On the first trading day of the year 2022, Goldman Sachs share price opened at $387.10. The bulls only enjoyed a few days of rally as price reached the year’s high at $413.33. This mark was hit on the 5th of January which was the third trading day of the year.
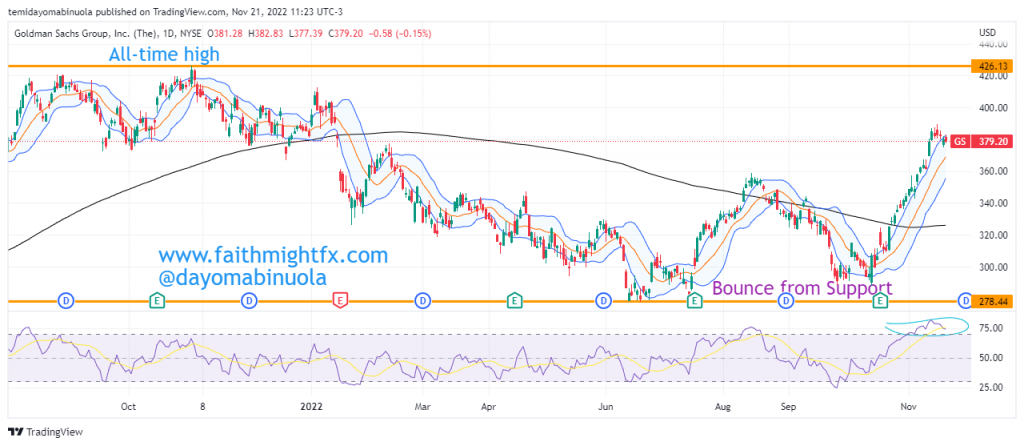
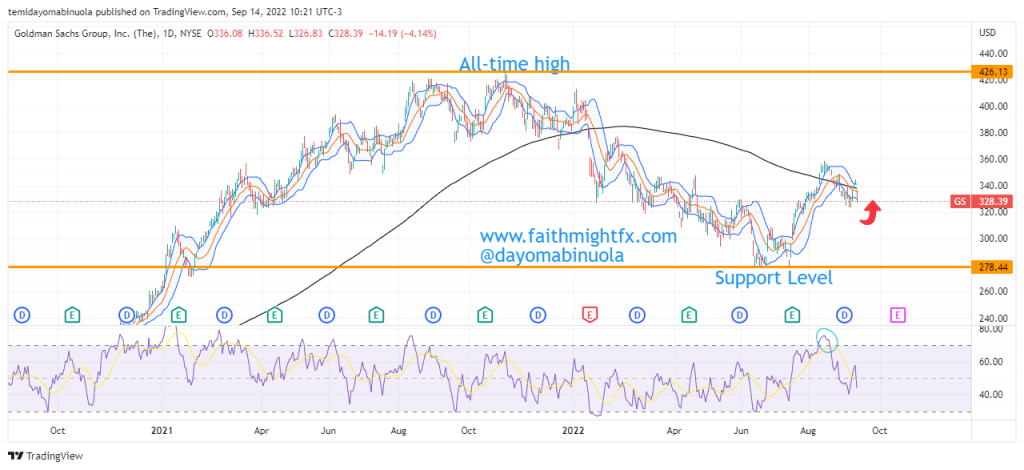
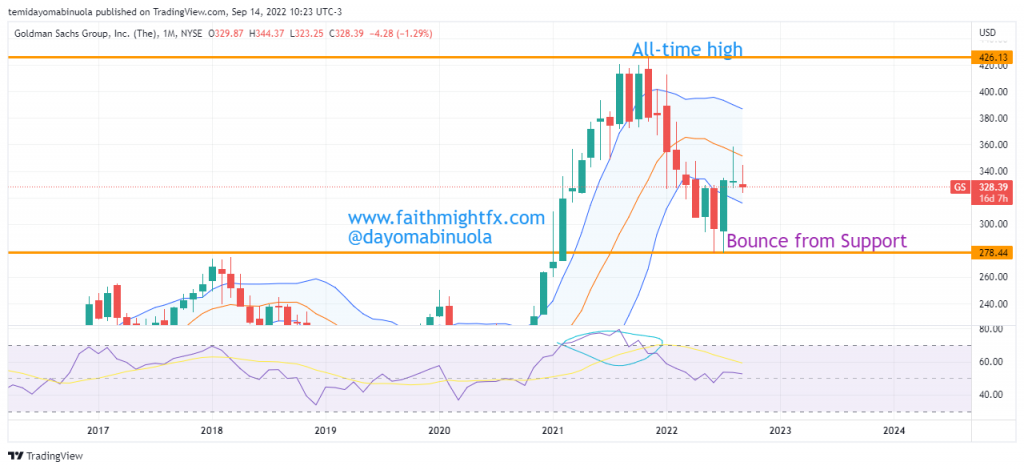
Following this rally that took price to the year’s high, the bears have been in control of the price movement causing a dip in price. This dip has seen Goldman Sachs’ price sink to hit the year’s low at $278.19 in July 2022. The last time price went this low was in January 2021. It is worthy of note that Goldman Sachs hit its all-time high in the same year 2021 at $426.50.
In the second half of this year, the bulls have become more active. There was a bounce from the year’s low to $359.50 in August 2022, which was also the initial resistance for the second half of 2022. When this resistance was hit, there was a correction on the weekly chart which caused price to fall below $300 for the second time in the year.
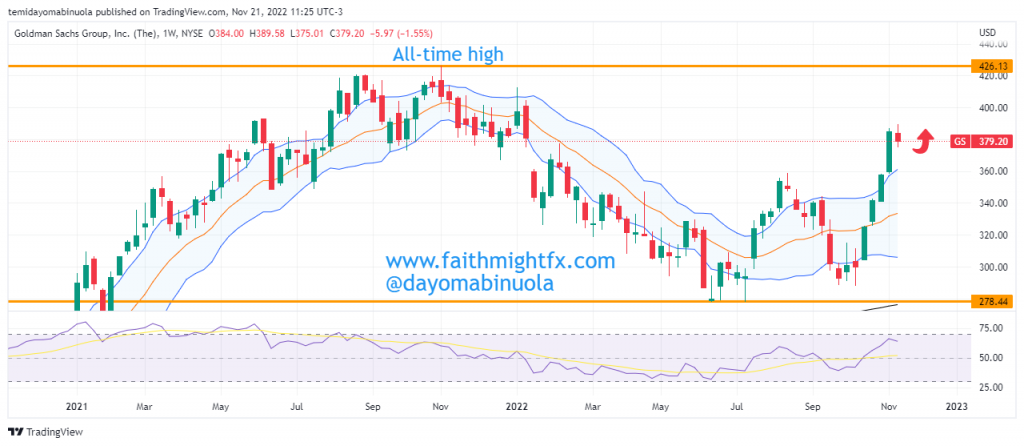
In October 2022, the bulls regained control of the price movement sending Goldman Sachs’ share price on a 6-week jolly ride upward. Price is currently at $379.14, which is the resistance level on the weekly chart. Although, RSI indicates price is overbought on the daily chart, it does not indicate that it is overbought on the weekly chart. Our analysts believe that this rally is strong enough to take Goldman Sachs’ share price to a new all-time high.
Some of these ideas are in our clients’ portfolios. To understand if this one can work for you or for help to invest your own wealth, talk to our advisors at FM Capital Group. Would you like more information on how to get stocks in your portfolio? Schedule a meeting with us here
