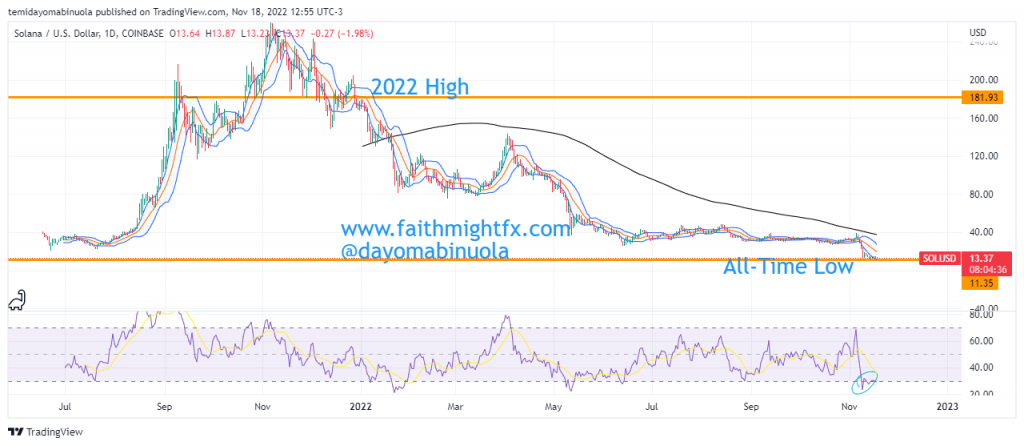
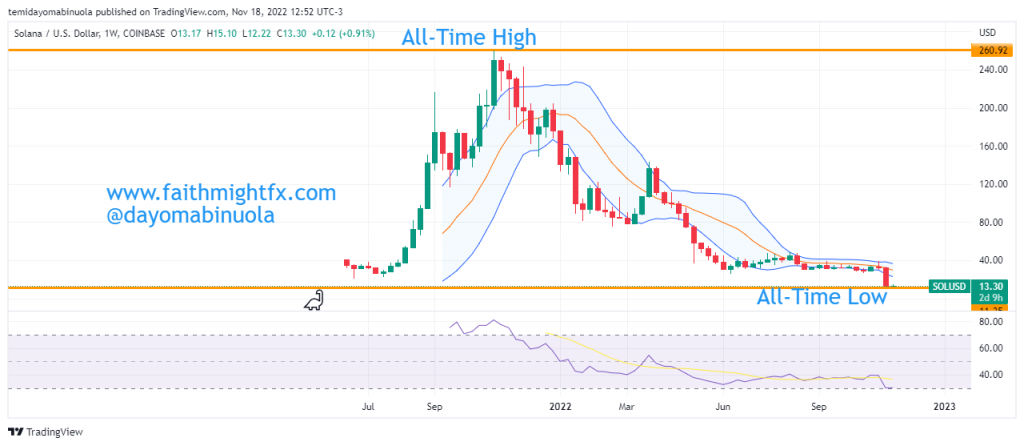
Solana is the tenth biggest crypto asset by market cap at over $8Billion. Typically, Solana’s price moves in tandem with other crypto assets like Bitcoin and Ethereum. In 2022 as other crypto assets went bearish, it followed suit and was all-bearish as well.
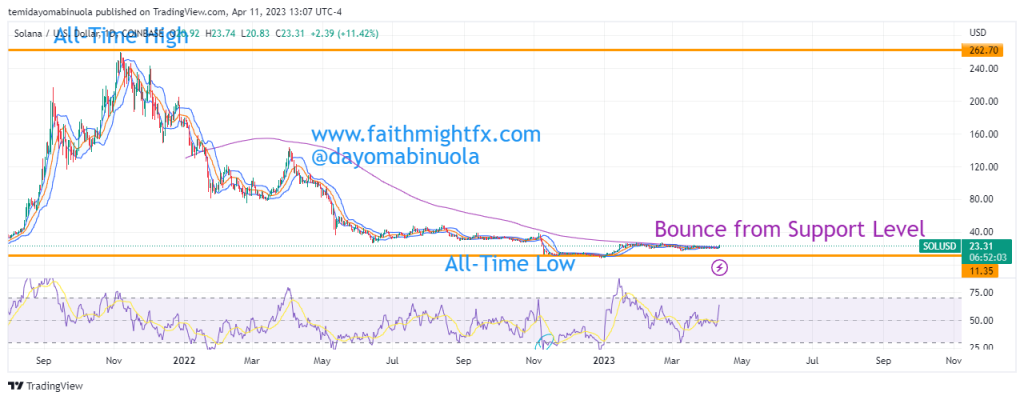
Solana’s high for last year (2022) was $179 and the low for the year was $7.80. It closed for the year at $9.46 and opened in 2023 at $9.98. Relief knocked on the doors of the crypto world and Solana’s bulls went into action early in January. By mid-January, price had rallied above $20. So far, this year’s high is $27 and that occurred in February.
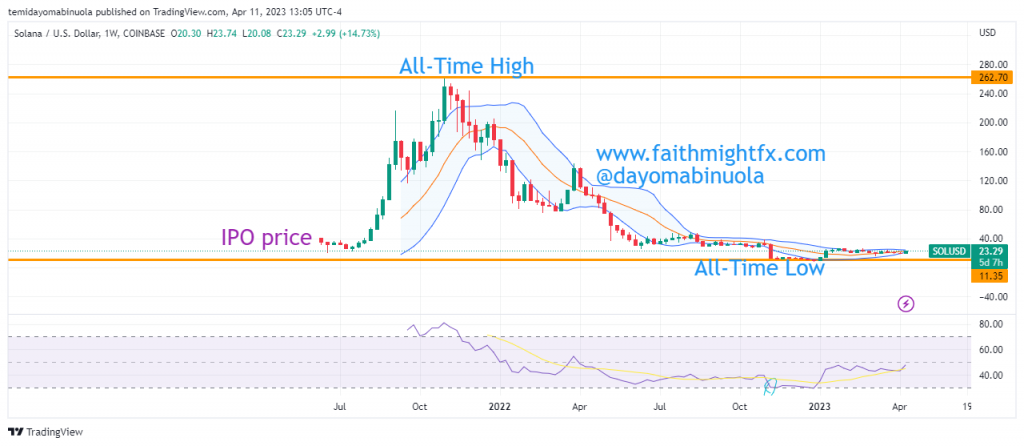
On a broader scale however, the weekly chart to be precise, it seems that Solana’s price was set for a range rather than a rally. Since the high in February, price has stalled while other crypto assets have picked up steam in the bullish direction. March and April have seen many crypto assets find new highs.
Solana is currently at $20 and RSI indicates that price is overbought on the weekly chart. Judging strictly from the RSI standpoint, price is supposed to dip. However, we think we might see a breakout to the upside above $27 in the coming months.
Some of these ideas are in our clients’ portfolios. To understand if this one can work for you or for help to invest your own wealth, talk to our advisors at FM Capital Group. Would you like more information on how to get cryptocurrencies in your portfolio? Schedule a meeting with us here
