The $GBPNZD has officially broken out on the larger timeframes in Wednesday’s trading session. After breaking below the major psychological level of 1.85, the pair has extended losses from there to trade at 1.83 in early Asian trading. At the European open, those losses have extended further to 1.82.
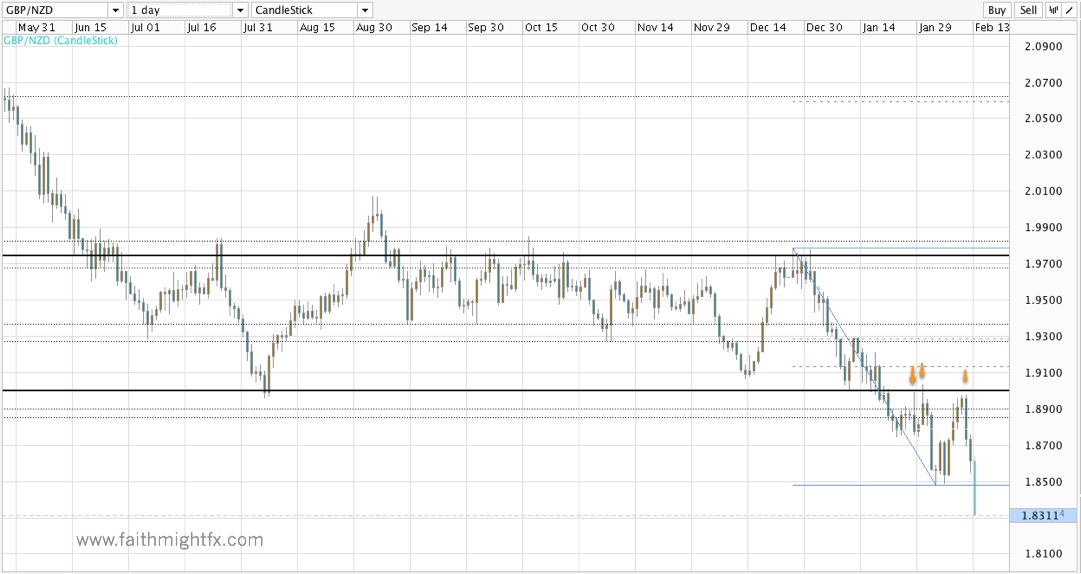
Technically, the hold below 1.90, despite the spike highs, set the stage for a breakout to the downside in $GBPNZD. 1.90 marked the bottom of a consolidation range that held for well over 2 years. With the pair now below the 2011 lows, the pair is in uncharted territory trading at all-time lows.
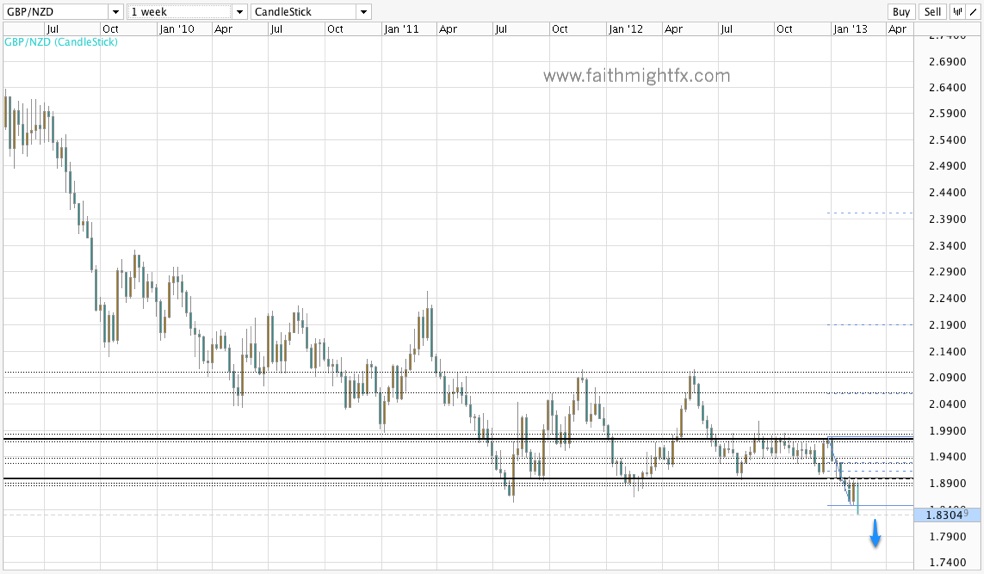
To trade a pair that has no historical reference, it becomes prudent to either trade the psychological levels that tend to exist at the whole numbers and 50-pip intervals. Because the $GBPNZD moves in such wide swings, a trader can capitalize on moves from whole number to whole number with an eye on how price behaves at the 50 level. Another approach, is to remain on the sidelines as price falls and then enter trades on a correction. After the correction, the pair has left some historical support levels in place that a trader can now use as a guide when prices turn lower.