The movement of $FTSE 100 has been between 7900 and 6900 this year. During this time, $FTSE 100 reached an all- time high in May at 7900. Several stocks in the US this year reached an all-time high. In the first quarter of the year, more sellers traded $FTSE 100. Towards the end of the first quarter, a breakout occurred which made price remain bullish till June. After this, a long-term range began. Later in August, a breakout downward occurred on the daily chart. Price reached 7290 and bounced upwards to touch the middle Bollinger bands line. Price went further down and broke out the support level, forming a new support level at 6924.
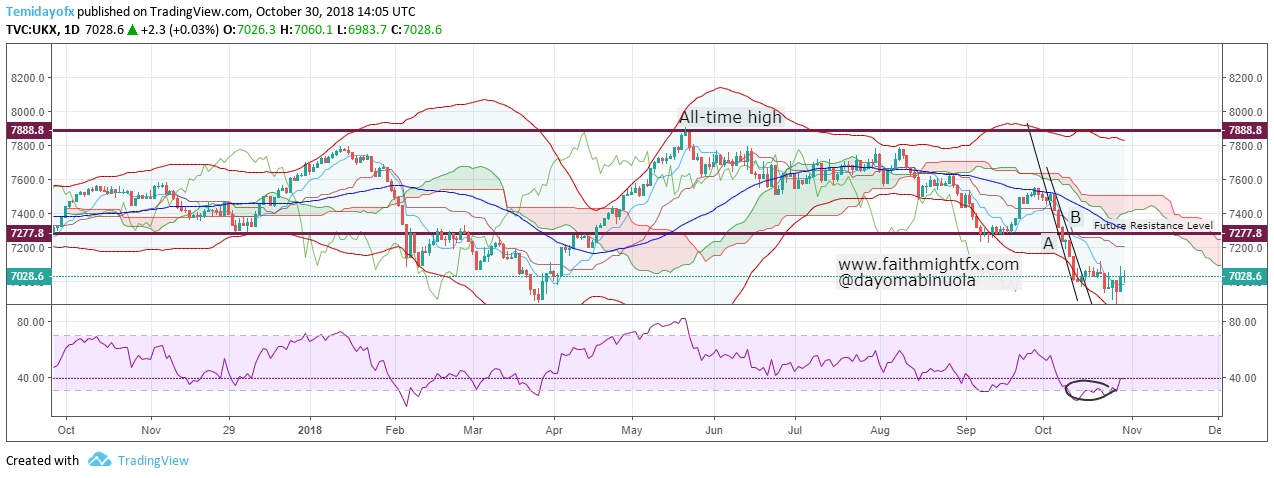
Recently, RSI showed oversold when price reached that new support level at 6924. Since August, when price of $FTSE 100 comfortably closed below in the lower section of the Bollinger bands, price never closed in the upper band. An expectation of about 200 pips upward might be realised on $FTSE 100 trades soon. Indications from the trendlines show a breakout already occurred while price remains in a range. The future resistance level is expected at 7277. Ichimoku has not shown a trace of a reversal but the bull gangs might push the price of $FTSE 100 upwards.