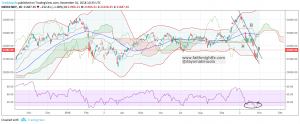
October was not too good for Nikkei. The stocks began a downtrend moving over 3000 points. That’s a big loss for the stocks in $NKY. The highest level $NKY reached in 2018 was at 24372. This level was reached in the early days of October where RSI showed us an overbought region. This gave rise to a reversal. For the most part, the $NKY, in 2018, is dominated by sideways movement on the daily time frame. Having been oversold from the downtrend in the latter days of October, price was at 21067 level. The last time price got to 21067 was in March 2018.
The Senkou Span from Ichimoku shows a downtrend future, but has yet to show a reversal signal. RSI shows an oversold region at 21067. Price of $NKY already touched the lower Bollinger band line thereby leading to a bounce upward. Using the price movement on the trendlines, price already broke out, which indicates a bullish trend is about to begin. This bullish movement might touch the middle line of the band which is at level 22821. From now, price of $NKY might generate over 1000 points from 21700 to 22821.

Leave a Reply