The price of $JPM found solace around 102.90 level at support and 119.21 level at resistance in 2018. This is a price movement of about 1800 points. That is a whole lot of profits for long term traders. However, the price movement of $JPM in the first half of the year was not good for bulls until July.
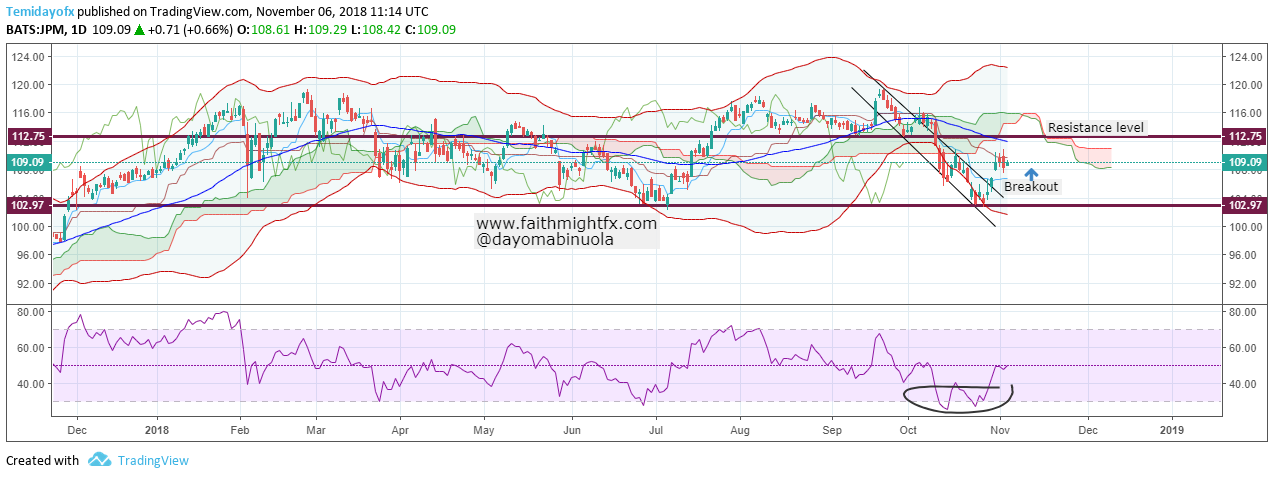
A breakout has occurred from the trendlines. This could be an indication for a bullish movement. Price is presently at 109.25 level and might reach 112.75. The RSI never fails in showing us when it is oversold so it may signal another buy in $JPM shares. Price movement to the upper part of the Bollinger bands may show a continuation in upward trend. Ichimoku gives no trace yet for a reversal in price of $JPM. A breakout of price occurred also from the resistance level. Price may move as high as 119.21, which is a major resistance level for this year.