On June 12, 2025, Air India Flight AI171, a Boeing 787-8 Dreamliner crashed just 30 seconds after takeoff from Ahmedabad, striking a medical college hostel and erupting into a massive fireball. The disaster claimed 241 lives on board and at least 28 on the ground, leaving only one survivor, a British-Indian passenger. This marks the first fatal crash involving a Boeing 787, severely damaging the aircraft’s previously strong safety record and triggering global concern. The incident comes as Boeing is already under regulatory scrutiny due to persistent quality issues with its 737 MAX line, and it now faces renewed investigation and reputational damage across both its narrow- and wide-body aircraft programs.
Just ten months after a mid-air pod failure on an Alaska Airlines 737 MAX 9 and with the FAA still capping 737 MAX output at 38 planes per month over quality concerns, Boeing now faces heightened scrutiny following a deadly crash of an Air India Boeing 787-8 Dreamliner. This fresh tragedy with the 787 adds pressure not only on Boeing’s operational credibility but also on its supply chain and certification oversight protocols.
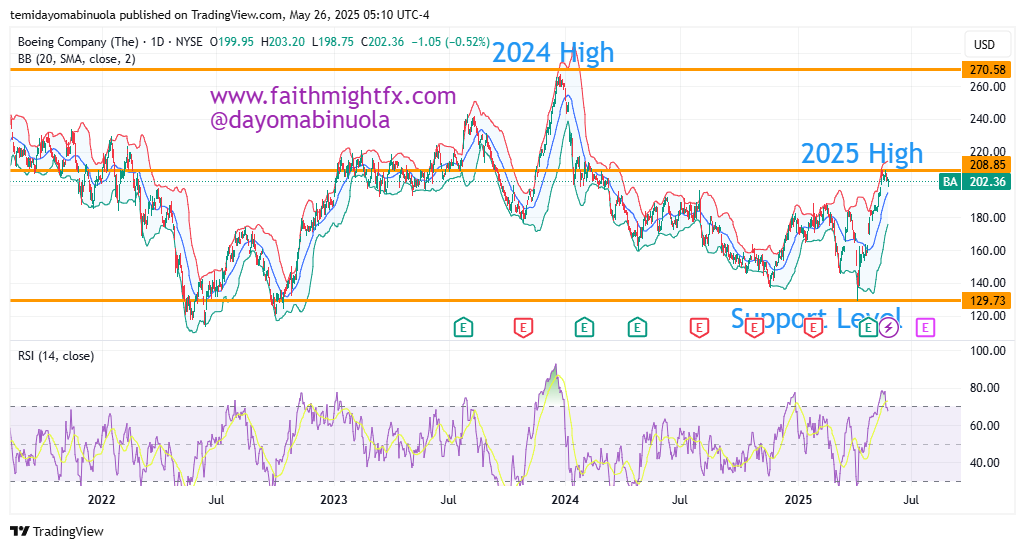
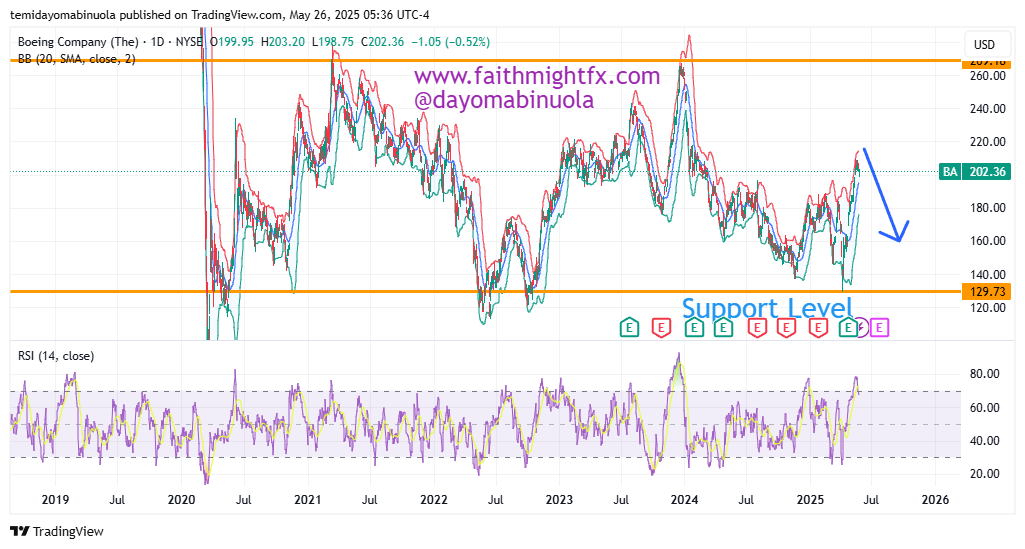
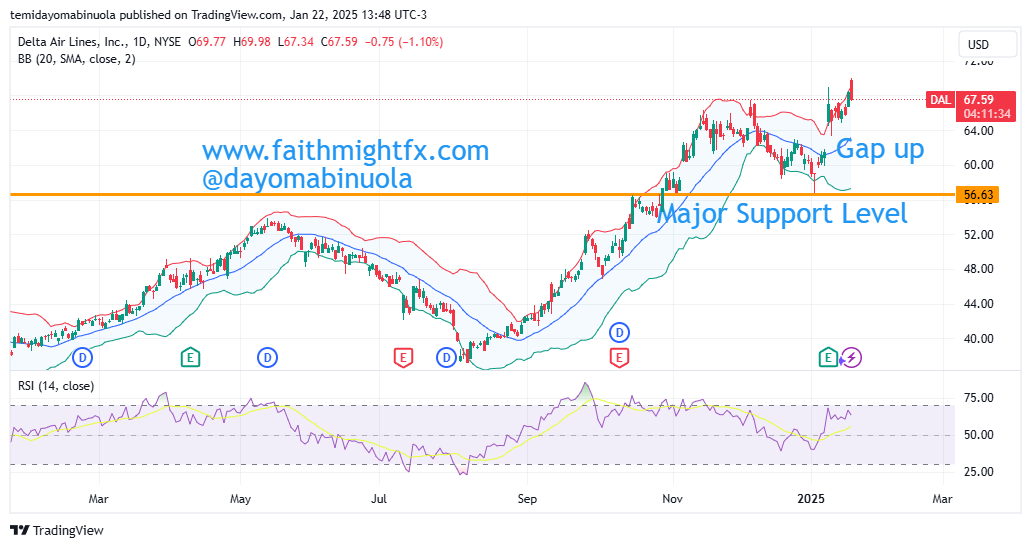
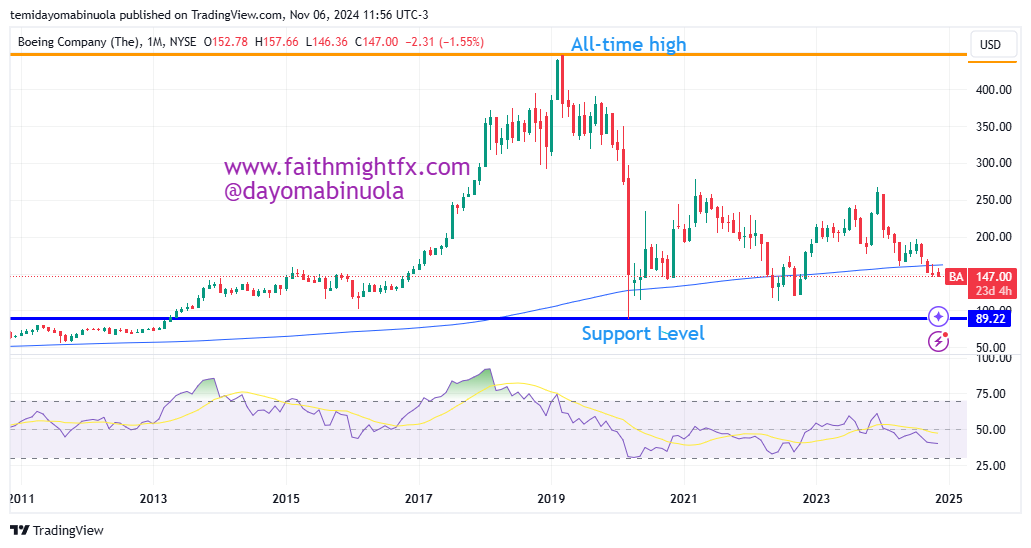
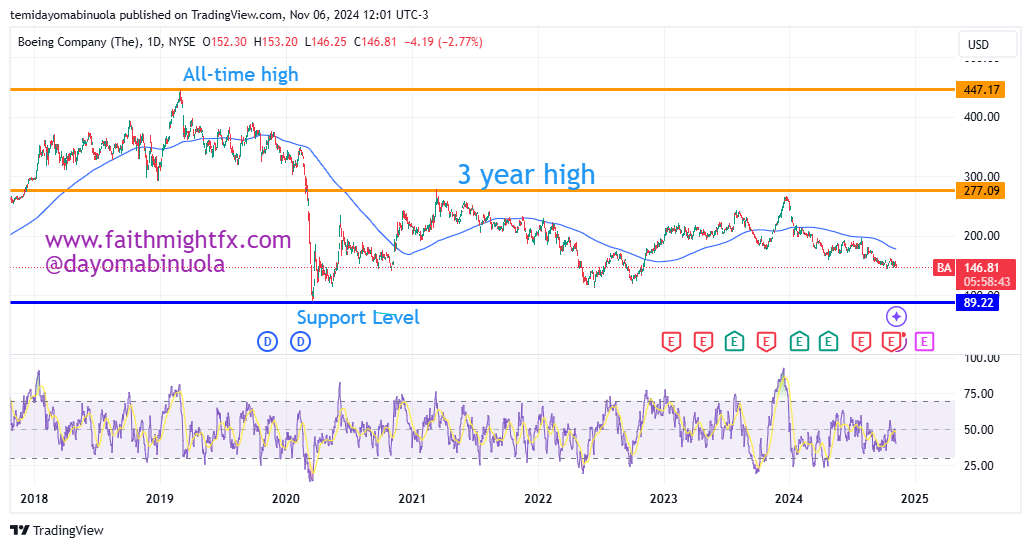
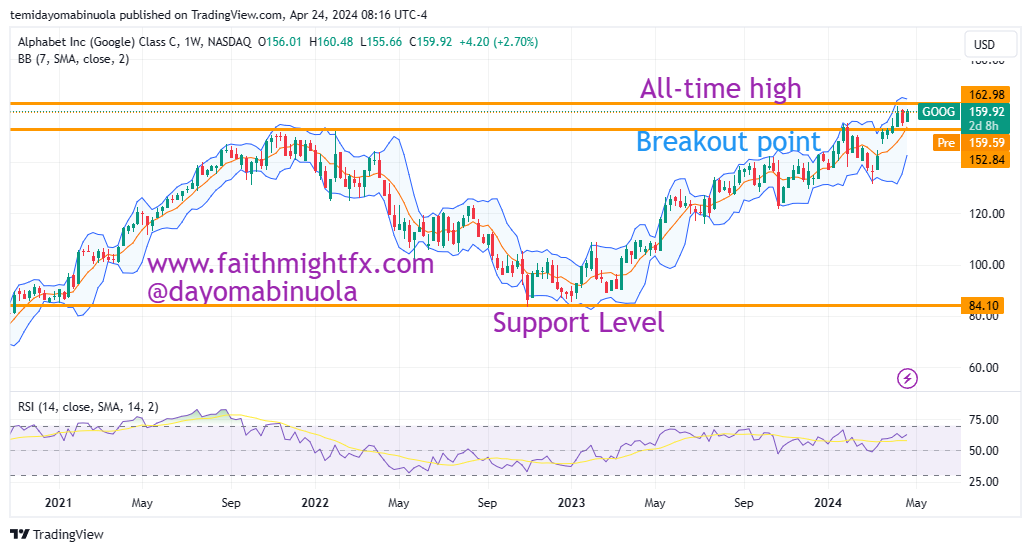
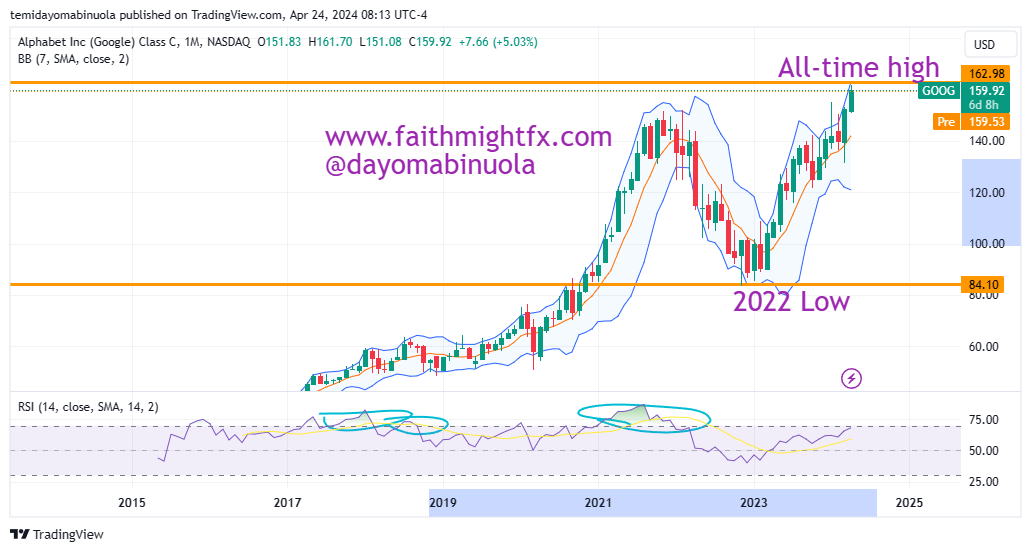
On June 12, 2025, Boeing’s stock fell around 5% after the crash, killing 241 people onboard and at least 28 on the ground, with only one survivor. The tragedy, the first fatal 787 crash, damaged the Dreamliner’s safety reputation and investor confidence. The stock is overbought and may face downward. With renewed FAA and possibly global scrutiny of the 787, analyst price targets could be pushed toward $135 if Boeing fails to reassure regulators and investors. RSI on the daily chart shows price is overbought.
Some of these ideas are in our clients’ portfolios. To understand if this one can work for you or for help to invest your own wealth, talk to our advisors at FM Capital Group. Would you like more information on how to get stock in your portfolio? Schedule a meeting with us here