In the early trading days in 2018, Microsoft’s share price broke out comfortably above $100. And since then, the price is yet to reverse toward $100. The bull run continued until February 2020 when the price reached $190.82. As at that time, a resistance level was formed around $190.82, which lasted for about 3 months, as the support level was $134.07 in March 2018. This correction was the longest one since 2018, which was about 29.7%. The next rally after the correction has made a price of $MSFT attain $281.11 price.
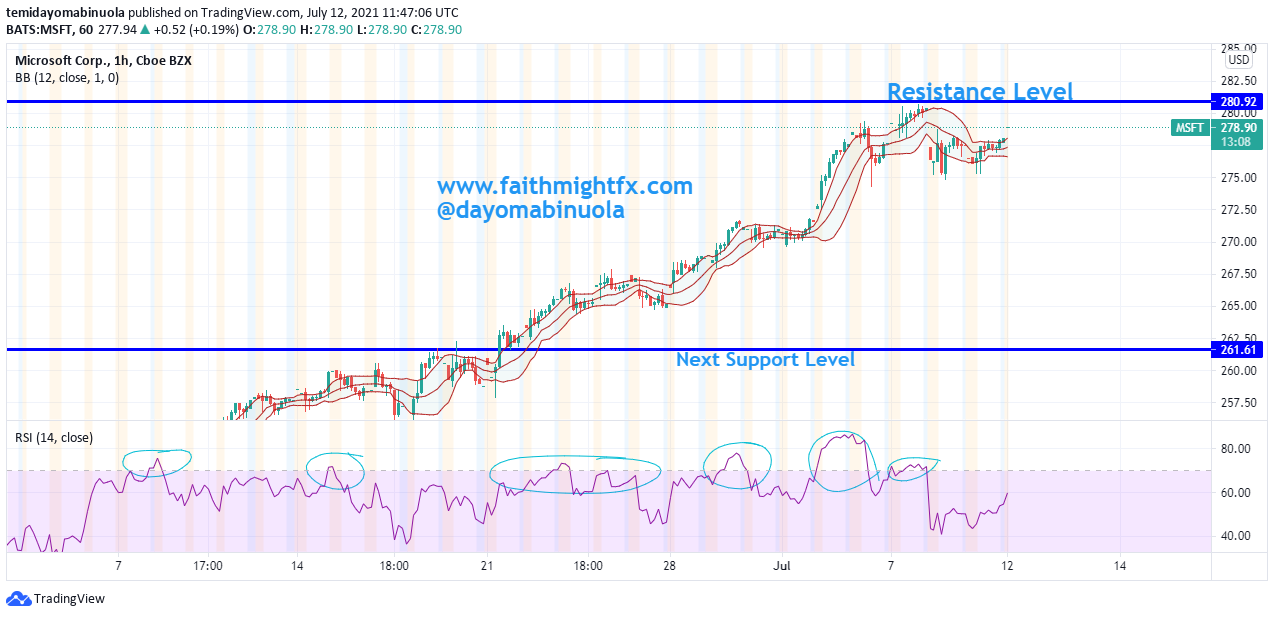
Over the years, $MSFT has been investing hugely in products with Augmented reality and Virtual reality. These investments could be the major reason for the bullish run in the past few years. The most recent all-time high was reached at $281.11, on the 7th of July. The chart has the majority of higher low and higher highs patterns. Since the beginning of June 2020, RSI has shown many levels where price has been overbought.
A reversal could occur as a gap down and a gap up was shown on the chart when the price was below $250. A higher low might begin, which might push the price lower to reach $262.03. Also, many stocks are currently at the all-time high or ranging around the all-time high.