Netflix had its IPO in May 2002 at $1.15 per share. In the first few months of going public, the share price went as low as $0.35. The share price ranged for about seven years with a resistance level of $5.80. The price broke the resistance line in 2009 to reach a new high of $43. From a fundamental analysis standpoint, this breakout was partly due to the positive comments coming from their business model change from DVD to streaming.

In the latter part of 2011 after the price reached $43, the share price saw a dramatic slump to $8. It dipped even further in 2012 to $7. However, the candlesticks in the last three months of the year 2012 all closed bullish which for the investors, was a silver lining in the dark clouds. As the year 2013 began, this bullish momentum exploded and the price rallied over the years to an all-time high of $700 in November 2021. This bullish trend was a marathon with few corrections that ran for nearly a decade (from 2012 to 2021). Every Netflix investor smiled to the bank during this period.

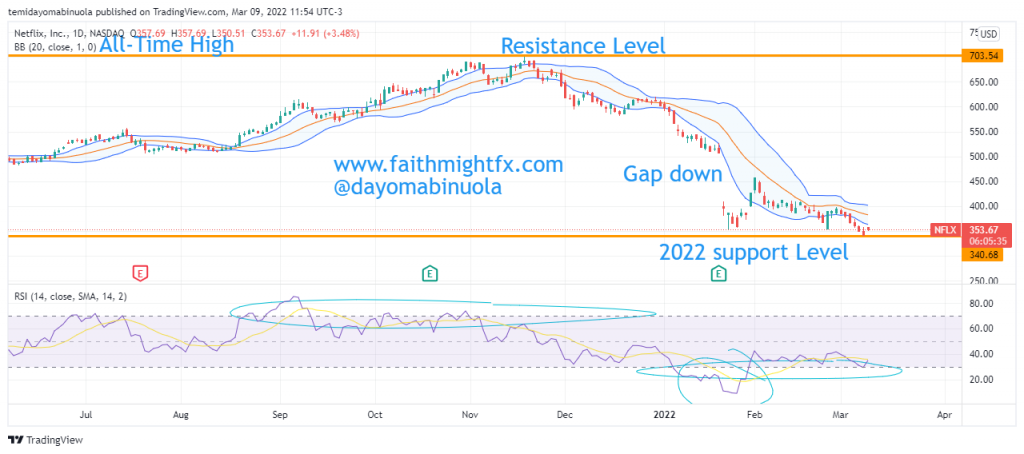
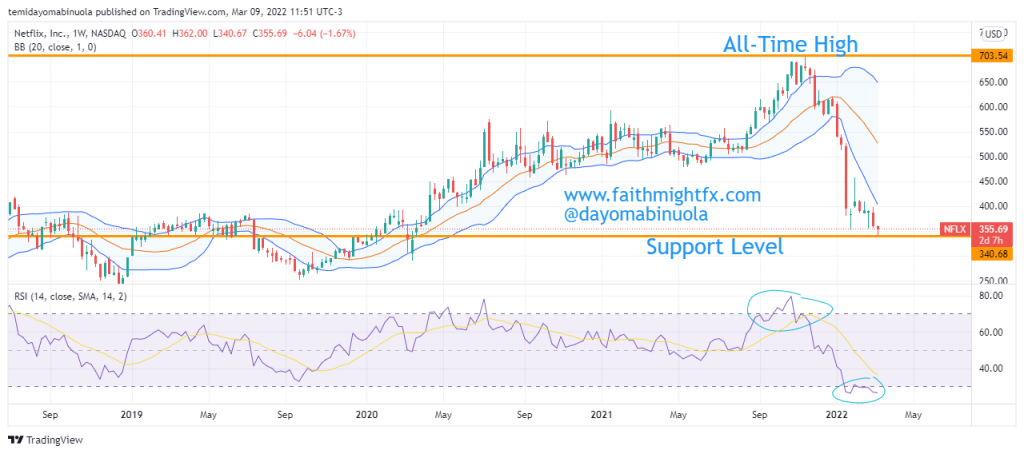
However, since the month of the all-time high in 2021, all candlesticks on the monthly chart have closed bearish. As of March 8, 2022, Netflix had lost more than 50% of its all-time high value. In August 2021, we forecasted a fall in the value of $NFLX to $409. Price fell beyond this expected price level. On the weekly chart, RSI has indicated that the price has been oversold since January 2022. This might be an indication that the price could rally in the coming months from its current value of $341 above $615.
Some of these ideas are in our clients’ portfolios. To understand if this one can work for you or for help to invest your own wealth, talk to our advisors at FM Capital Group. Would you like more information on how to get stocks in your portfolio? Schedule a meeting with us here.
Leave a Reply