fbpx

Netflix Rallies As Gap Down Closes

Netflix rallies as gap-down closes

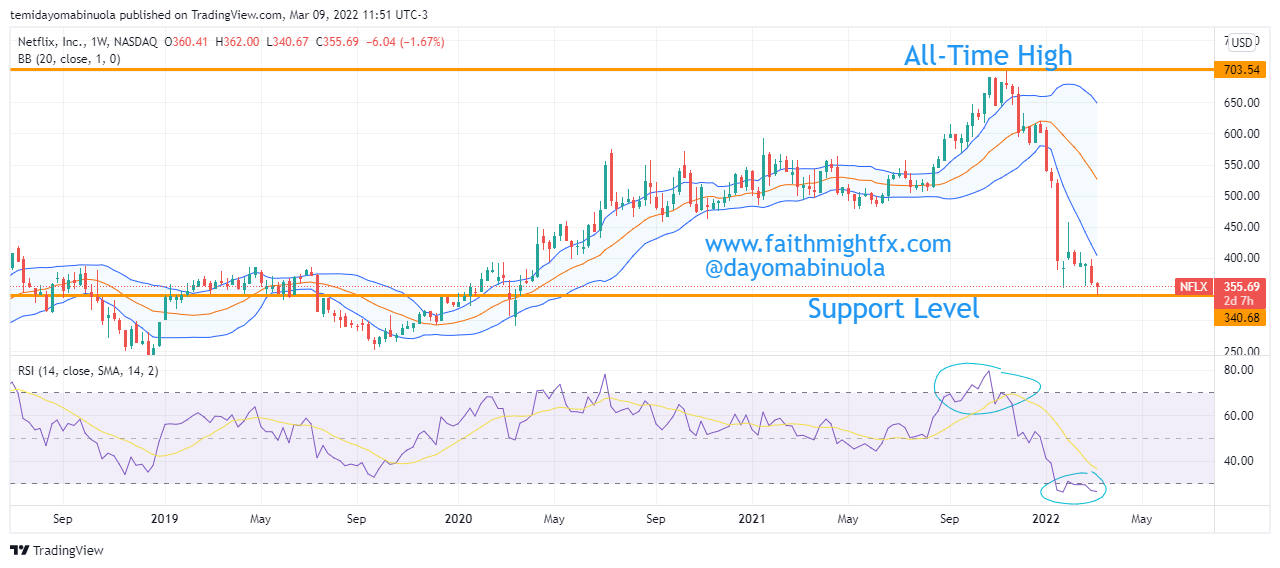
The share price of American media company, Netflix, has been on a rally since May 2022. As of 2022, Netflix had a revenue of $31.6billion with a total number of employees at 12,800. Early in 2022, Netflix lost 200,000 subscribers from its platform and then in June 2022, it laid off 300 employees. The loss of subscribers may have led to these layoffs. Netflix Co-CEO Reed Hastings in June 2022 claimed that the current employee base will grow by 1,500 before the end of 2023.

Daily Chart


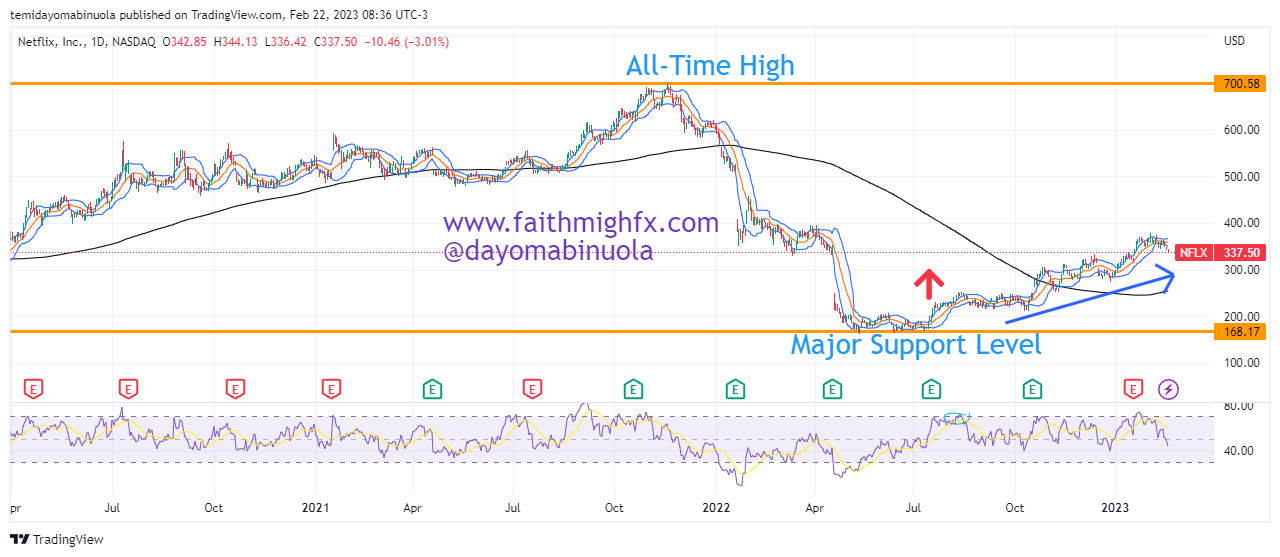
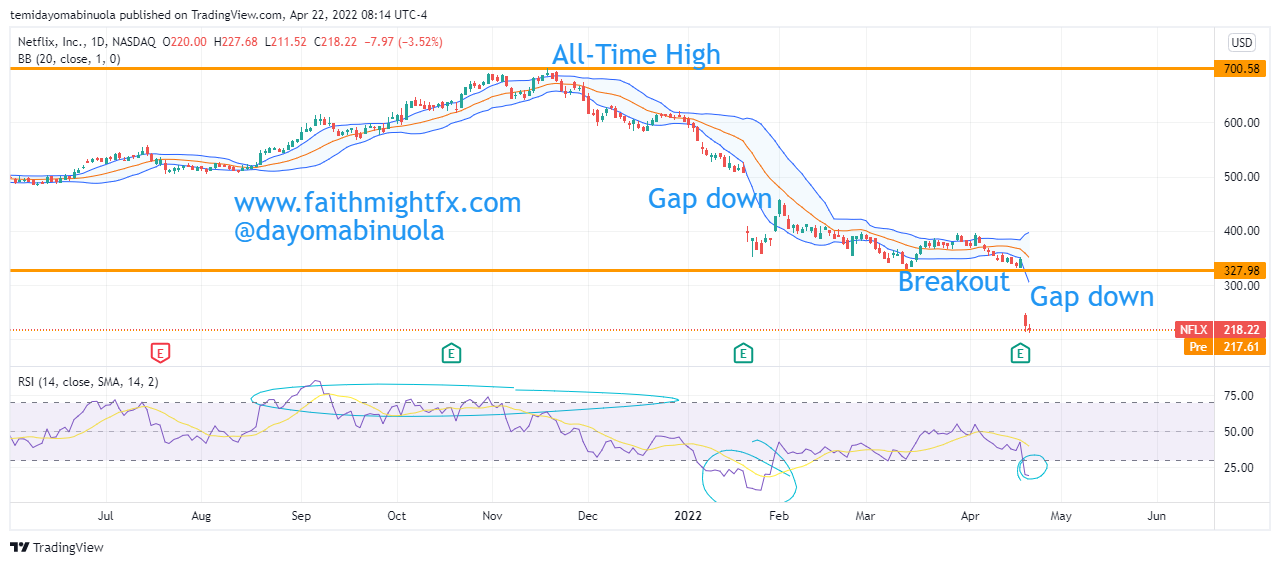
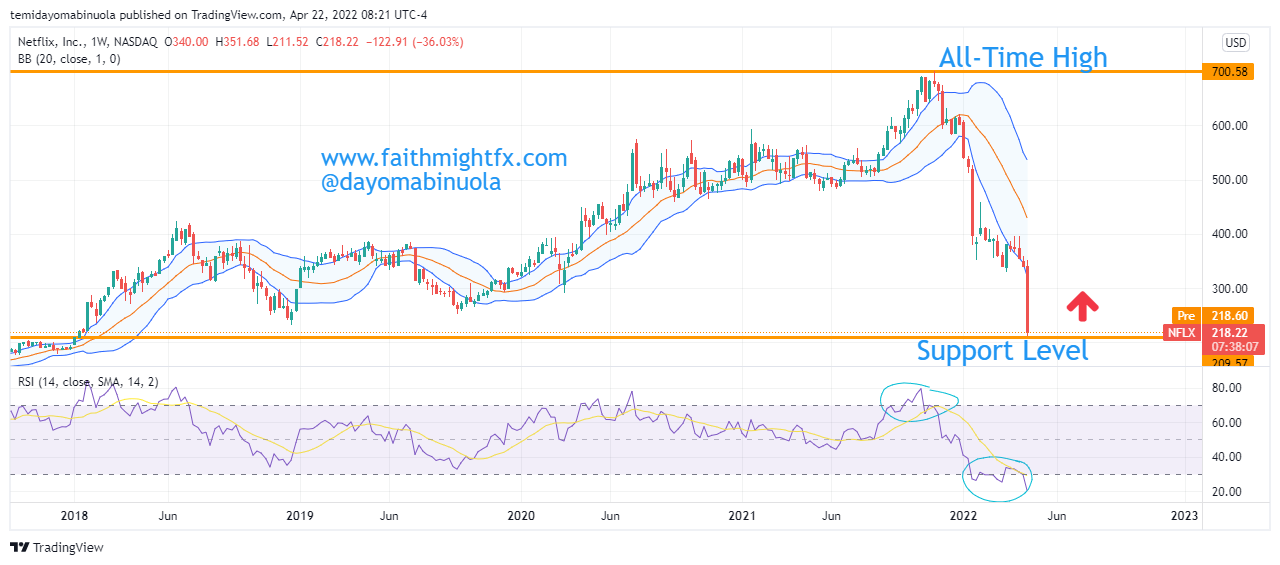
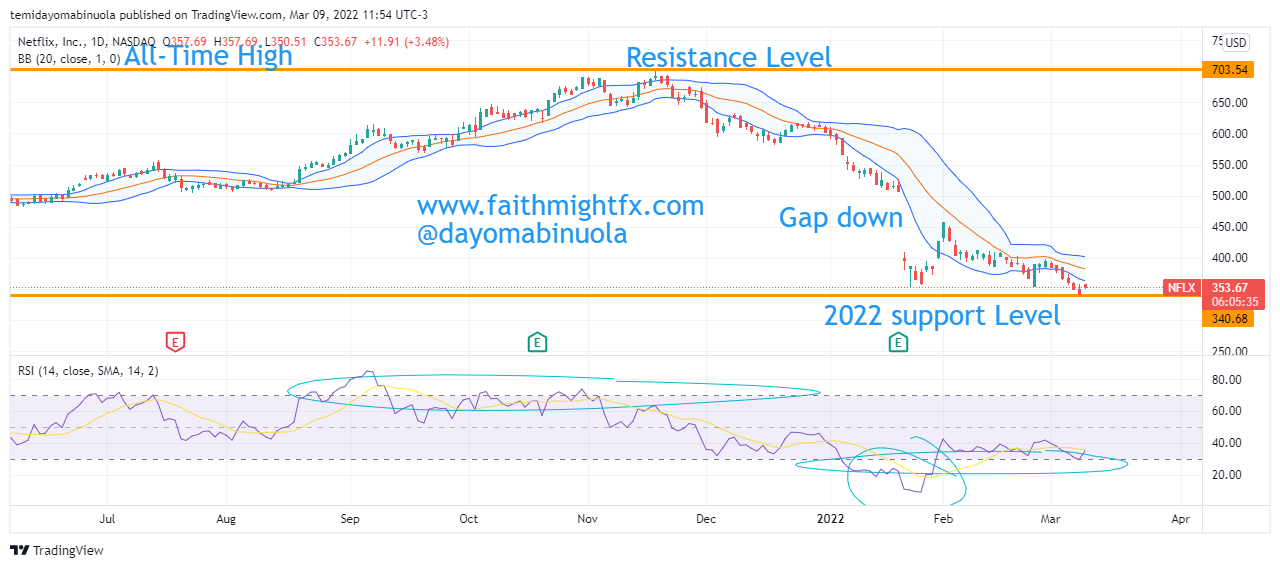
In 2023 alone, tech companies have laid-off 93,000 workers in the US. Some of the numbers are Alphabet 12,000, Microsoft 10,000, Amazon 18,000, Crypto.com 500, Coinbase 2,000, Salesforce 7,000 among others. The current share price of $NFLX stands at $337.50 after a rally from the major support level in May 2022 at $163.02. Prior to the price hitting $163.02, there was a gap down from $331.04 to $245 in April 2022. Since the gap down, price ranged until a breakout occurred in October 2022. This rally has continued for the past 5 months.

Weekly Chart

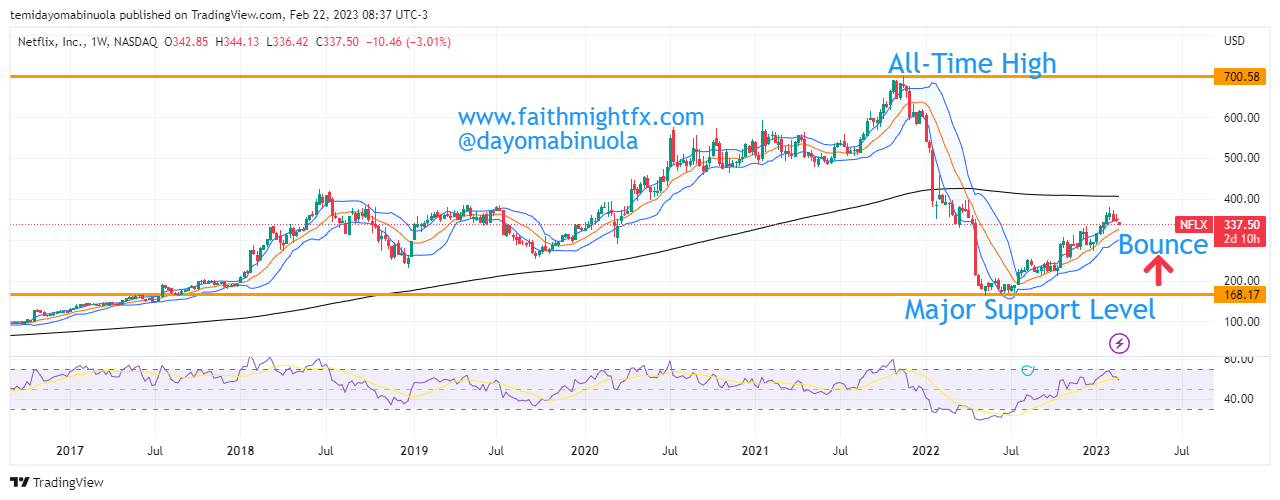
The recent rally has made $NFLX recover from the losses it accrued as a result of the gap down in May 2022. We are hopeful price could appreciate further in the coming weeks. The psychological level of $400 might be reached soon.

Some of these ideas are in our clients’ portfolios. To understand if this one can work for you or for help to invest your own wealth, talk to our advisors at FM Capital Group. Would you like more information on how to get stocks in your portfolio? Schedule a meeting with us here

Netflix To Rally Despite Sudden Price Dip

Netflix reached its all-time high at $701 in November 2021. Since then, the price has plummeted dramatically over the last 5-6 months. This huge slump has taken the price to $218, making it the worst fall ever. This fall is about a 70% loss from the all-time high of $701. As a result of the price fall, Netflix investors are yet to make a profit this year.

Daily Chart

On the daily chart, a gap down occurred on January 21, 2022, from $507 to $399 and the price is yet to retrace. In the process of the price falling during this gap down, it hit a target we forecasted in an article we published in August 2021. Another gap down occurred on the daily chart on April 20, 2022, from $333 to $246. As of April 21, 2022, the price closed at $218 as a consequence of this last gap down, thereby making $218 the most recent support. Price last hit this point in January 2018.

Weekly Chart

In the last few days, $NFLX reported a loss of over 200,000 subscribers in Q1 2022. There are speculations that Netflix will lose over 2million customers in Q2 2022. Despite speculations, we foresee a price rally and we expect both gap-downs to be filled. This price rally should take the price to $387.

Some of these ideas are in our clients’ portfolios. To understand if this one can work for you or for help to invest your own wealth, talk to our advisors at FM Capital Group. Would you like more information on how to get stocks in your portfolio? Schedule a meeting with us here.

Netflix Share Price Continue To Nosedive

Netflix had its IPO in May 2002 at $1.15 per share. In the first few months of going public, the share price went as low as $0.35. The share price ranged for about seven years with a resistance level of $5.80. The price broke the resistance line in 2009 to reach a new high of $43. From a fundamental analysis standpoint, this breakout was partly due to the positive comments coming from their business model change from DVD to streaming.

Daily Chart

In the latter part of 2011 after the price reached $43, the share price saw a dramatic slump to $8. It dipped even further in 2012 to $7. However, the candlesticks in the last three months of the year 2012 all closed bullish which for the investors, was a silver lining in the dark clouds. As the year 2013 began, this bullish momentum exploded and the price rallied over the years to an all-time high of $700 in November 2021. This bullish trend was a marathon with few corrections that ran for nearly a decade (from 2012 to 2021). Every Netflix investor smiled to the bank during this period.

Weekly Chart

However, since the month of the all-time high in 2021, all candlesticks on the monthly chart have closed bearish. As of March 8, 2022, Netflix had lost more than 50% of its all-time high value. In August 2021, we forecasted a fall in the value of $NFLX to $409. Price fell beyond this expected price level. On the weekly chart, RSI has indicated that the price has been oversold since January 2022. This might be an indication that the price could rally in the coming months from its current value of $341 above $615.

Some of these ideas are in our clients’ portfolios. To understand if this one can work for you or for help to invest your own wealth, talk to our advisors at FM Capital Group. Would you like more information on how to get stocks in your portfolio? Schedule a meeting with us here.

Netflix’s Price Has Been Consolidating

The first half of 2020 started so well for Netflix investors as the price remained bullish. The lockdown must have aided the bull run as many countries were on lockdown, getting on Netflix was one of the ways to maximize the lockdown. Before the lockdown, between January 2018 and January 2020, the price of $NFLX was ranging between $228.51 and $421.60. But in May 2020, a breakout to the upside occurred as price brokeout the then $421.60 resistance level. The highest price level $NFLX reached this year was at $591.89, resulting in major resistance. The resistance level at $591.89 was last reached in July 2015 when $NFLX had a stock split at 7 for 1, as the price moved from $662.25 to $110.69.

A head and shoulder pattern is being formed as price retraces back to $569.19. RSI has indicated at two different times of price being overbought between July and August 2021. A reversal might occur, which might result in a sell-off. $NFLX might lose about 160points from the current price at $569.19. Price is currently maintaining the upper region of the Bollinger bands. This year’s support stands at $479.57. As sell-off begins to occur, the year’s gain might be wiped out, as the price might reverse to $409.96.

Netflix Might Be Ready For A Dip in Price

The Netflix stock price in 2019 has been majorly characterized with a stable market price. This occurred as a result of an uptrend that began at the latter part of December 2018. Initially at the beginning of the year, when the price of $NFLX rose, it reached an overbought region on the RSI. Instead of the price of $NFLX to fall, price continued to go upward at a very slow pace. Since February, price has consistently been ranging on the daily chart between 343.81 and 382.87.

Netflix Daily Chart

For the most part of 2019, the candlesticks have maintained the higher region of the Bollinger bands. Despite the trendlines being broken to the downside late last year, the price of $NFLX has ceased to fall. The future of Ichimoku does not show an actual direction of the market. Nevertheless, $NFLX might be losing its bull power temporarily. Price of $NFLX could fall below 351 in the coming days from its current 371.83.

Netflix Retesting Resistance

Netflix share price attained all time high in June 2018 with a profit gain of over 100% for all of 2018. After this height, a fall in share price began from 422.77 to 232.78. About 45% fall in price turned the stock bearish in the 2nd half of 2018. Bulls have been more active in 2019 with $NFLX gaining about 100 points. On the third trading day of the year, price had already moved up to the upper section of the Bollinger bands.


Price of $NFLX has since retested support level before the bounce; price is currently around the resistance level. A breakout of the trendlines to the downside has occurred making $NFLX to drop in share price. The drop might continue if more sellers get into the market. However, the candlesticks are yet to cross to the lower section of the bands indicating price is still in the buying region. Ichimoku is yet to change direction from its bullish side to being bearish. Nevertheless, RSI has shown that price of $NFLX is currently overbought. Price might fall over 30points depending on the activities of $NFLX sellers.