
In December 2013, AMC had its IPO at $11.80. Since its IPO, it rallied to form a high at $22 in 2015. In 2016, it fell again to $11.93, a slump that plunged the price almost back to the IPO level. Towards the close of 2017, it rallied back to 2016’s high which completed a double top pattern.
The double top led to a price reversal in 2017 as price dipped to $1.23 in 2020 as a result of the global lockdown. There was a relief in 2021 as price rallied to an all-time high at $44.85 which was in June 2021. The following month, which was July, price reversed and a bearish turn began. Since July 2021 till date, AMC Entertainment stock has been falling.
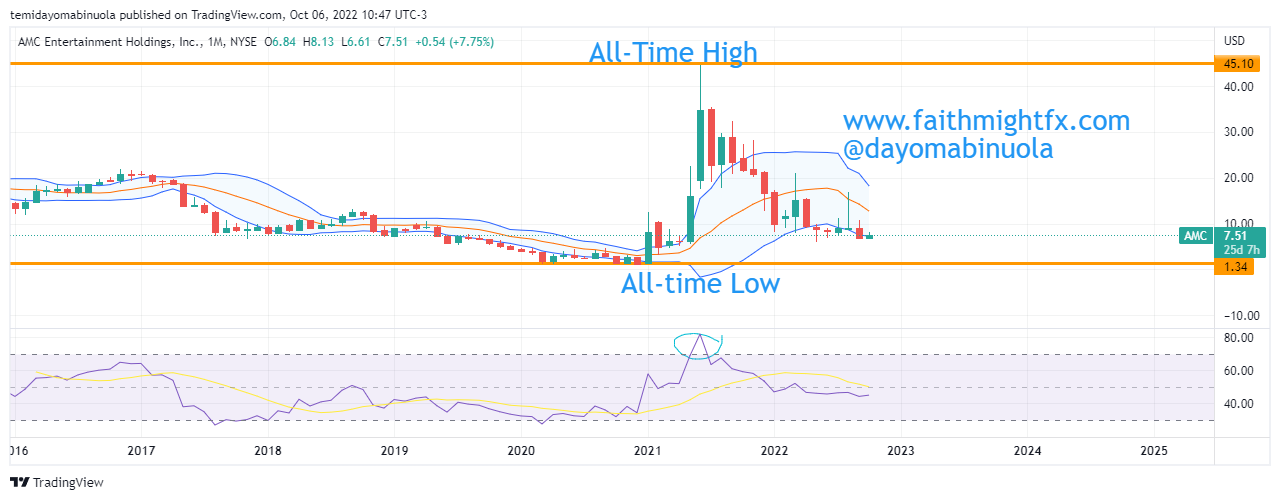
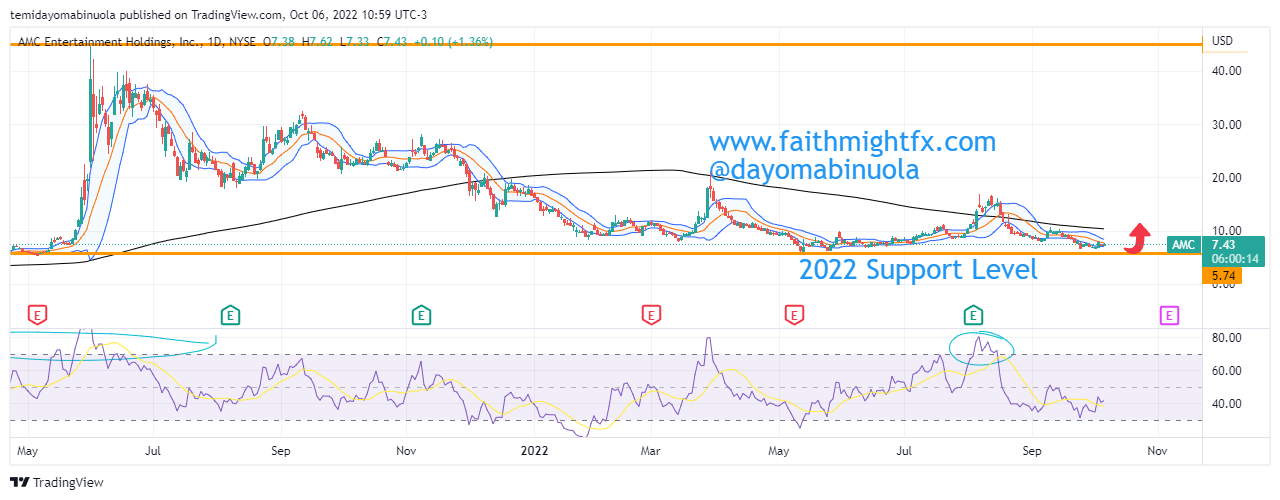
In 2022, using the monthly chart, all candlesticks have been trading in the lower region of the Bollinger Bands. Since the all-time high in June 2021, RSI has indicated that price has been overbought. Our analysts forecast a rally to $10 in the coming weeks.
Some of these ideas are in our clients’ portfolios. To understand if this one can work for you or for help to invest your own wealth, talk to our advisors at FM Capital Group. Would you like more information on how to get stock in your portfolio? Schedule a meeting with us here