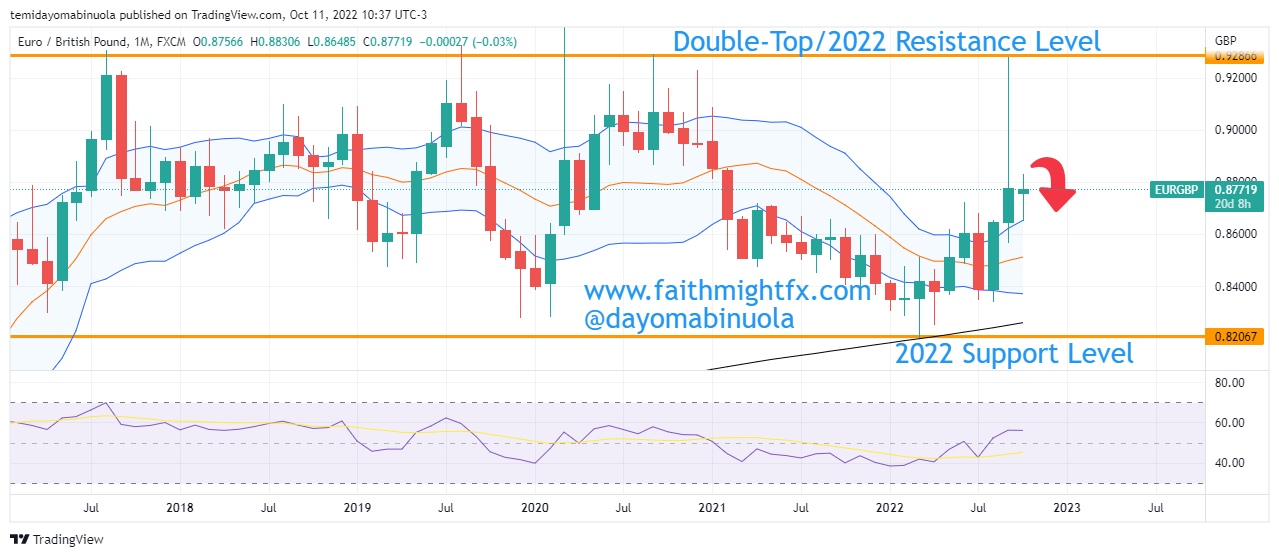
The first half resistance for the year was at 0.87265, which was in June 2022. There was a break-out to the upside in September has price rallied to 0.92758 in September 2022, which is this year’s high. After the rally to 0.92758 on the 26th of September 2022, the next trading day closed bearish which has led to more bearish close. The bulls tried to push price high to 0.88188 in October after a price fall to 0.86495.
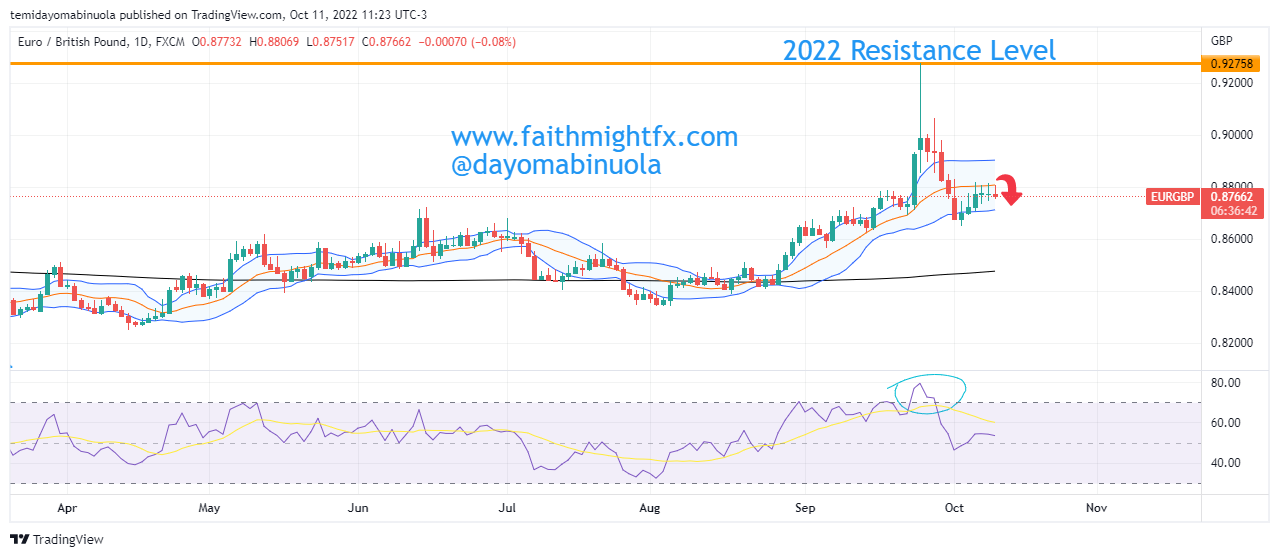
The last 2 trading days have closed with a doji. The price might also close with a doji today, which could be an indication of price reversal to the downside. If the price falls, the support level at 0.86495 might be broken to the downside. The Daily Chart shows the RSI has been overbought, which the daily candlesticks indicate a possible price reversal in the coming days.
Some of these ideas are in our clients’ portfolios. To understand if this one can work for you or for help to invest your own wealth, talk to our advisors at FM Capital Group. Would you like more information on how to get currencies in your portfolio? Schedule a meeting with us here