fbpx

That Crazy-Oct-2014 Candle

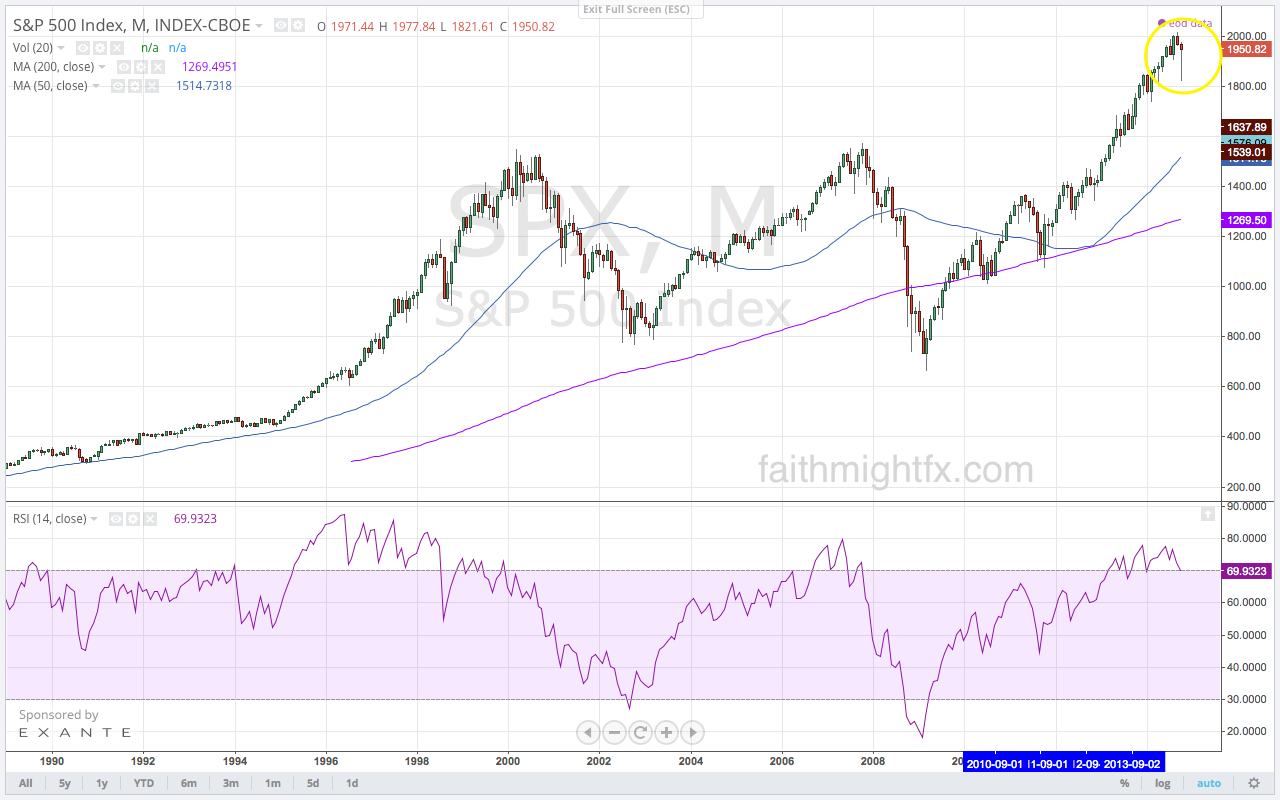
Stocktoberfest fever is hitting the streams and it has every reason to. Howard Lindzon and the team have built an incredible buzz around the conference over the years. The buzz is beating louder as we all get ready to head down to Coronado Island to open the last week of October trading. While I watch the equity markets, I (almost) never write about them. But this candle on the $SPX is as crazy as I’ve seen on this large a timeframe.

SPX monthly chart

After a such a sharp dip last week, price action in US equities did look good this week. The $SPX staged a very impressive rally that crushed resistance and Fibonacci levels. Now all eyes remain on the looming 50-day moving average. Next week, bulls and bears will duke it out right into the end of the month. Sentiment is riding hard on each.

S&P 500 index monthly chart
Who wins?

Divergence Sets The Opportunity

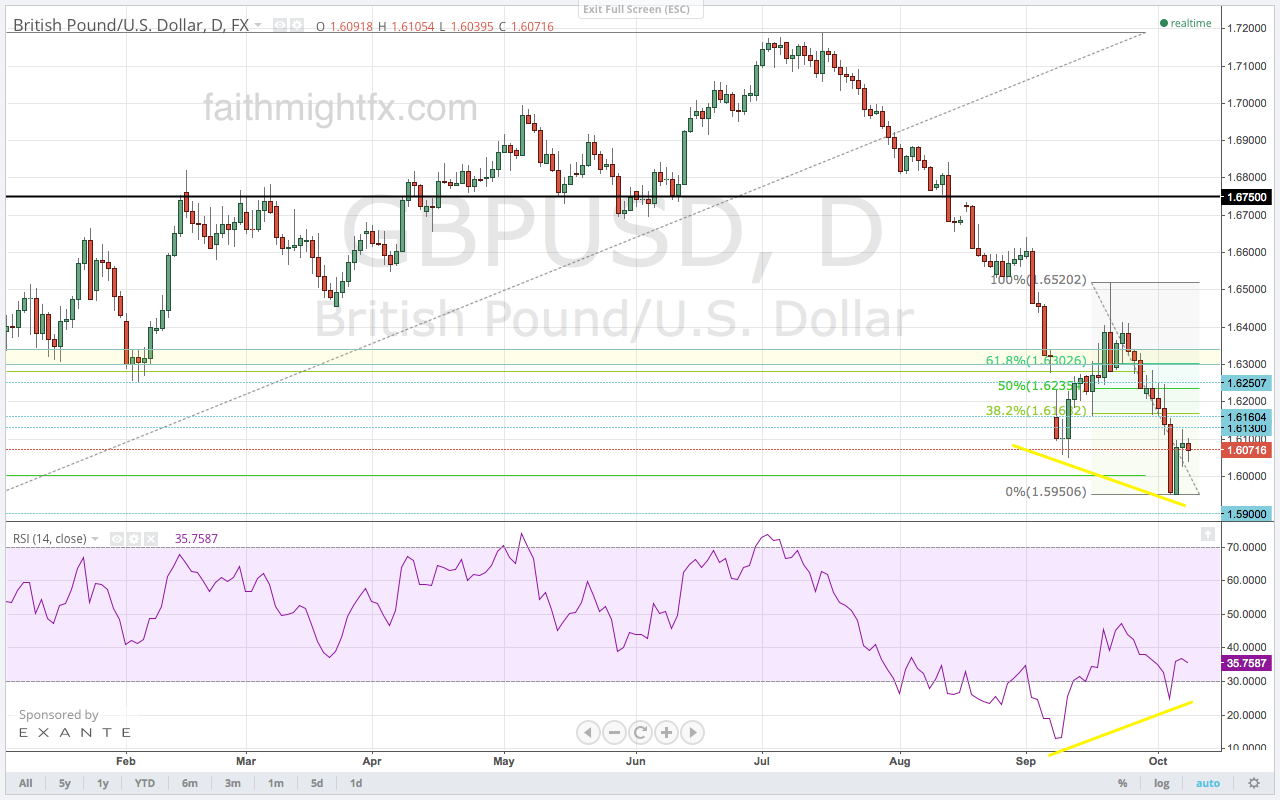
The $GBPUSD has finally breached the 1.6000 level even closing last week below the big psychological level. It is a level that marked the 50% Fibonacci level of the 2013 rally in cable. Since Friday’s break, however, cable has managed to stage a small, corrective rally back above 1.6000 as high as 1.6130. And despite the pullback from those 1.6130 highs, there is still potential for $GBPUSD to see higher levels on this bounce.

GBPUSD DAILY CHART

This RSI divergence here on these new lows suggest that this bounce should continue higher into the Fibonacci levels. The 1.6250 level is historically a huge resistance level. Price could also get a boost higher with the release of the FOMC meeting minutes today and the Bank of England monetary policy decision tomorrow. If so, any rally higher becomes as an opportunity to set up for further weakness in cable. The RSI and data releases may give swing traders opportunity to set up at higher, more attractive levels before another push below 1.6000. Bears should be patient and bulls should not get too giddy. Trade what you see.


Euro Finds Its Feet

The EUR has taken new ECB policy very hard. In 2014, the currency has lost over 600 pips against the pound sterling and 1,500 pips versus the US dollar. Those are substantial moves. You have to ask yourself if the short euro trade is not already crowded. Couldn’t it stand to reason that the currency rally into the end of the year? If not, for a couple of weeks? For now 1.2500 $EURUSD has managed to stymie the weakness there. $EURGBP is also bouncing off its multi-year support at 0.7750. Now that the ECB has pulled the trigger on negative interest rates and bond buying, the markets are breathing a sigh of relief and covering positions. It’s a new quarter after all. This 1st full week of trading could see the euro stage a corrective, relief rally.

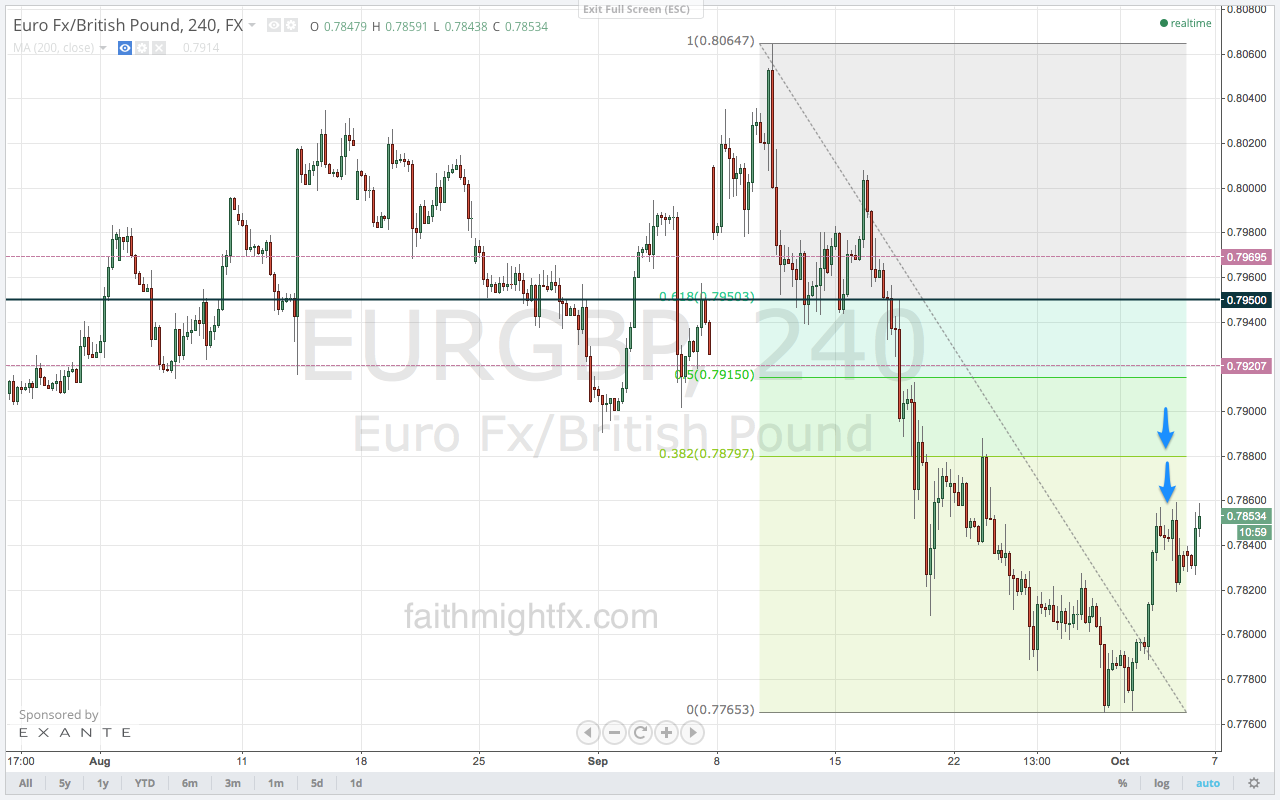
EURGBP 4 hour chart

So far, the $EURGBP remains stuck in its huge wedge formation. Price has found resistance all trading session at the 0.7960 level. However, swing traders are looking to the 38.2% Fibonacci level at 0.7880 and 0.7920-70 for an indication of supply and demand. That’s the upside potential.

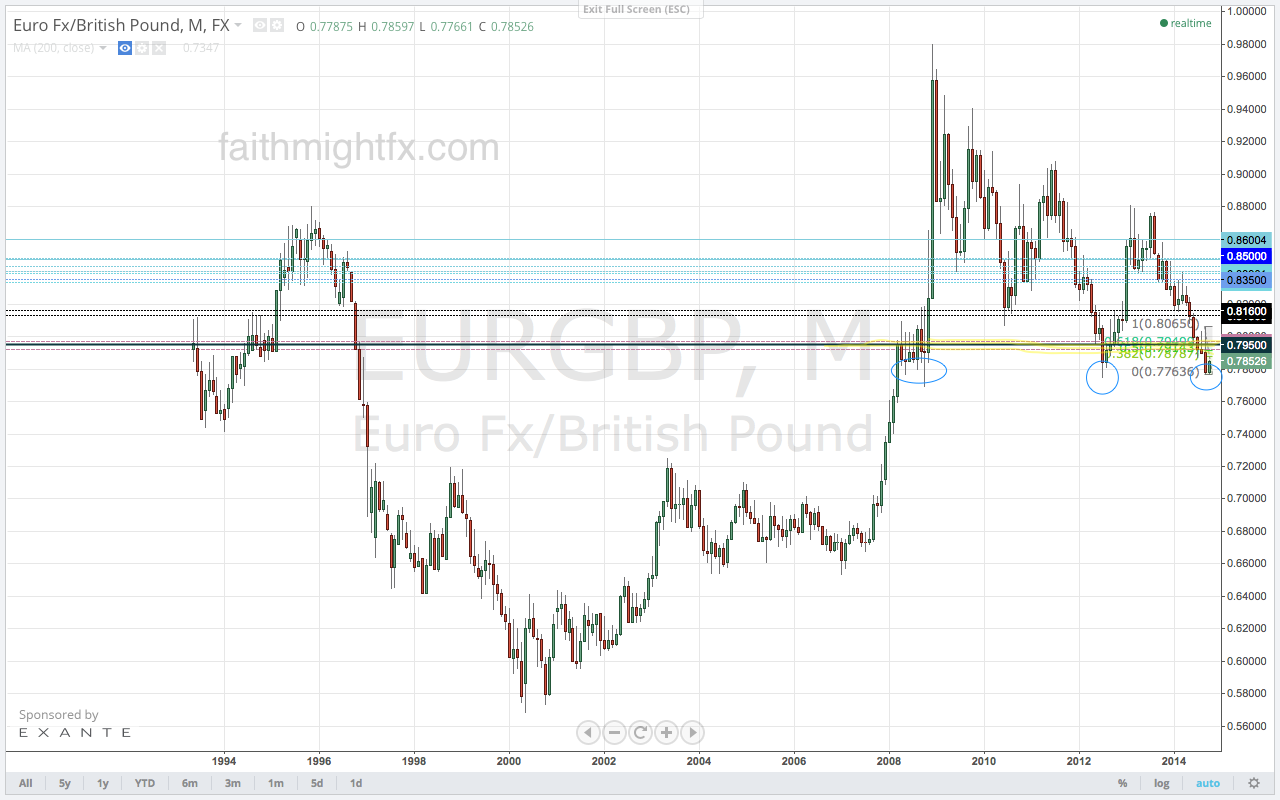
EURGBP MONTHLY CHART

However, the downside has serious potential. A break below 0.7750 has huge implications with support not likely until 0.7500/7400.  For as long as the ECB is accommodative in the face of tightening out of the BoE, the long-term potential is certainly in the bears favor.


Majors Meltdown

Ivaylo Ivanov of SocialLeverage50 tweeted this sweet currency chart this morning before the US open. With 1 more day until it ends, it pretty much sums up the entire 3rd quarter of 2014.

stocktwits chart posted by ivanhoff
Everything at their chart extreme except for pound

Which surprised you the most? Sterling has been pretty resilient to the USD strength as it found favor in the face of a majors meltdown. The currencies of the G10 all melted this quarter and all to pretty significant support levels. Except for the pound sterling. Even the mega rally in the USD is at a significant resistance level. Is GBP a laggard? Or the exception? A signal of future strength in the currency? Or future weakness?

Source: Image credit

The Aftermath of NO Vote

So the United Kingdom has avoided divorce and remains united after all as the Scots voted against independence last Thursday. The market has responded with massive sterling strength across the board. In fact, we have breakouts in the $GBPJPY, the $EURGBP, and the $GBPNZD as the weakness in the cross currency serves to exacerbate these rallies.

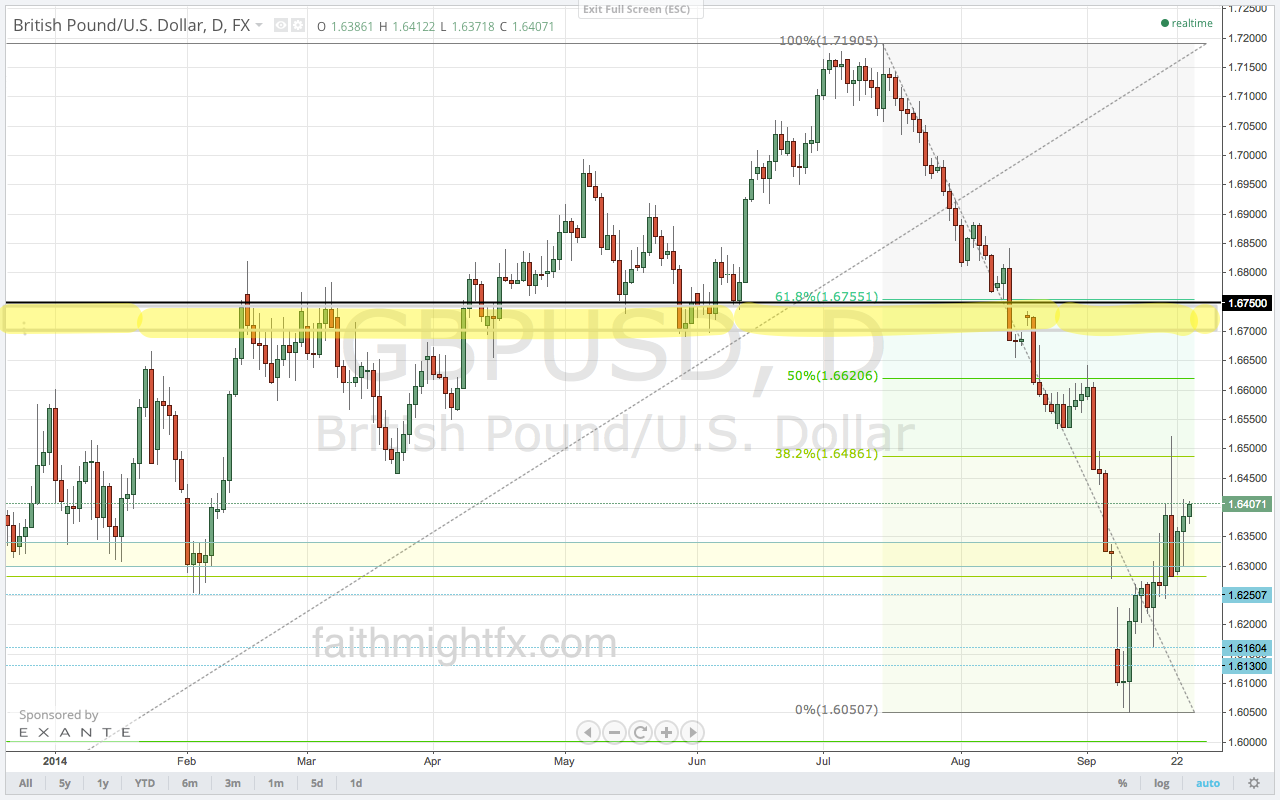
The $GBPUSD, however, may not rally like its cross pairs. This relief rally in cable is still a corrective rally and will likely meet resistance at the 1.6750 resistance level. Furthermore, there is confluence at this major level as the 61.8% Fibonacci level of the entire decline also falls at this level.

GBPUSD DAILY CHART

Before the 1.6750, I’d expect offers to come in at 1.6500 and 1.6620, the 50% Fibonacci level. But it is the 1.6750 level where bulls will ultimately have to prove themselves.

Trade what you see.

The Scottish #IndyRef

IMG_4150.JPG

My first reaction was that market doesn’t care about my take so why would I have one. Each day, I attempt to approach the markets with humility because I don’t want to fall in love with a bias that will beholden me to a position. But if I’m really honest with myself, of course I have a take on the referendum!

I don’t think the Scots will go through with it. And if I’m right the market will flail about for a few hours, or days, and go back to trading the status quo. And the stays quo is that the economy is not as strong as it was a year ago. Wage growth, the new forward guidance, is tepid at best. No matter what Carney says, I don’t think he can convince a majority of the MPC to raise internet rates until there is more proof of inflation beyond house prices. In fact, the weakness in commodities actually buys the BoE some time as energy prices are even less of a drag on inflation than they’ve ever been before.

If the Scots prove me wrong and vote in independence, then the pound sterling will weaken fast and sharp across the board. A currency crisis will literally materialize in a matter of hours as markets deal with a sudden GBP currency union or a new Scottish currency.

So, in conclusion, my take is bearish GBP. But I know the markets can do whatever they want to do. So whatever you do with this “insight”, please do mange your risks appropriately and trade what you see.

Read also:

Image credit

The Sterling Digest, 15 September 2014: ref talk

aye or die!
Manifest destiny?

Of course, the only thing still on the wire is the Scottish referendum. But the Scots stand to rock the world as secessionists everywhere get emboldened by the possibility of independence. Naturally, the referendum polls are just as emotional as the voters they reflect. Sterling spiked to new weekly lows across the board as the Yes vote took lead last weekend. Then the No vote moved ahead as the trading week unfolded and sterling surged big time right back to familiar highs in all the GBP pair majors. Headed into the actual election this week, expect price to actually weaken as buyers take profit and sellers take advantage of the recent highs. Even with the Bank of England set to make a monetary policy announcement, all eyes this week are on the referendum vote. Friday, the day after the vote, will be the most interesting trading day of the week and may set the tone for the rest of the year.

Image credit

When Uncertainty Trumps Doves

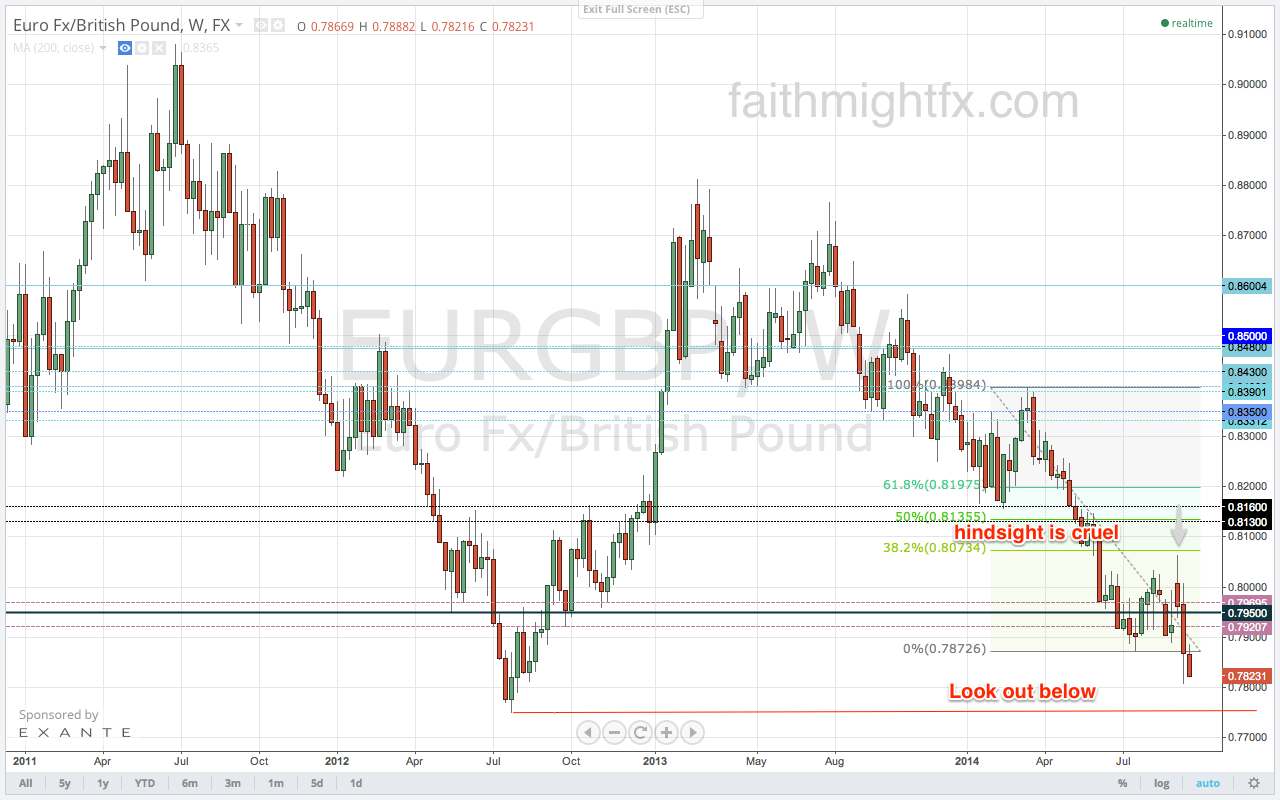
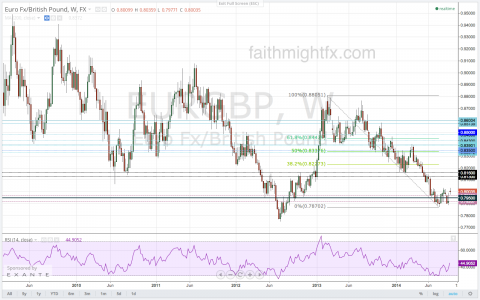
Remember this? The inverted head and shoulders pattern is messy but it is underway. As recent as last week, and certainly for the past 5, euros were sold hard to new lows. The ECB nor economic data out of the periphery EZ countries gave investors much reason to hold the currency versus the pound sterling. However, now that QE has started in the Eurozone, the certainty of that dovish cycle is everything right now to the uncertainty wreaking sterling right now.

EURGBP WEEKLY CHART

When we first looked at the reversal potential in $EURGBP, price targeted the 38.2% Fibonacci retracement level near 0.8100. However, now that the referendum polls have begun to spook markets and economic data is deteriorating, price has the potential to challenge the former weekly lows at 0.8160.

Read also:


Is This Really A Trend Reversal

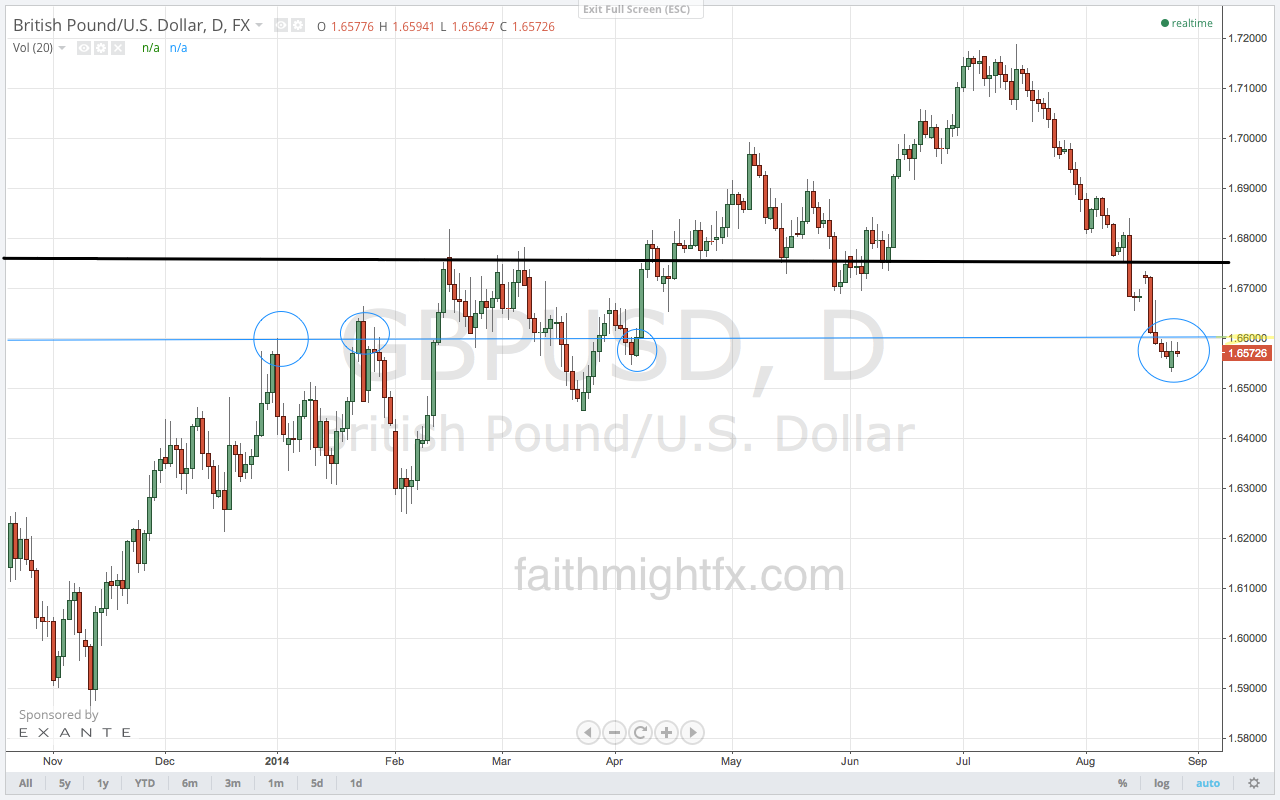
Another slow session, another day this remains true. In order to really belabor the point, I wanted to post the price action that has developed in the past week. The chart pretty much says it all.

gbpusd_8_26_14_8_25_AM

A hold below targets the bottom of the chart long term. This 1.6600 is nearly the 61.8% Fibonacci level on the weekly chart that was broken last week – the ultimate perversion of any long-running trend. The fact that the range top is this critical support level is not lost on me. But there are still bulls out there. Given the breakout rally over the last year, I understand the sentiment. And so the hold below 1.6600 has been met with just enough dip buyers to keep price supported. If strength does build above 1.6600, then a hold above it starts a correction that makes 1.6650 a key resistance zone. If this is really a reversal, price will hold below 1.6650 on any moves to the upside above 1.6600. If bulls really do have some mojo, we’ll see price break higher to 1.6750.