fbpx

The Sterling Digest, 11 July 2014: stalling

Stock market cartoon from Twitter
Bulls are stalling

Advancement in the GBP trend has stalled this week. Manufacturing and construction data missed this week and the Bank of England’s hold on monetary policy turned out to be a non-event. Sterling weakened briefly on the policy announcement but momentum never really took hold in either direction. Dips were bought but highs were also met with enough offers to keep price capped for another week. This stalling, sideways action is simply consolidation of the bull rally that has gained strength in the past month. Now as the 1st full week of trading of the 3rd quarter comes to a close, sterling remains in a tight range. Despite the tepid price action this week, sterling remains fundamentally strong. Between the US Federal Reserve and the European Central Bank, the BoE looks tremendously hawkish. Until that contrast changes, it is enough to keep sterling supported long term.

Image credit


All According to Plan

It’s nice when a trading session goes according to plan. Retracement levels were tested yesterday as sterling consolidates recent gains ahead of Thursday’s Bank of England announcement. We started the week with these charts. We staked out our levels. But it is not enough to make a plan. You have to have some conviction to put your orders on too. It doesn’t pay, if you don’t play. Position-sizing is a very underappreciated skill. It takes more discipline than you would imagine to establish a position in the market with the correct size. Too big a position and the risk may take you out before you can earn the reward. Too small a position and the reward just isn’t as satisfying for your account balance. I find that by scaling into a position, you can spread the market risk across multiple, smaller trades maximizing the best price the market is giving. Once we determine our position, the hardest part of executing any plan is the action of inaction – we wait.

We didn’t have to wait long. Thanks in part to lower-than-expected manufacturing and industrial production releases, GBP fell across the board yesterday. Days like yesterday, you don’t have to do anything. Just watch price. In fact, if you are planning each trade and trading each plan, you should experience more days where you are simply watching price move at the market’s will. When it’s too tempting to watch price action, leave the screens or risk trading carelessly.

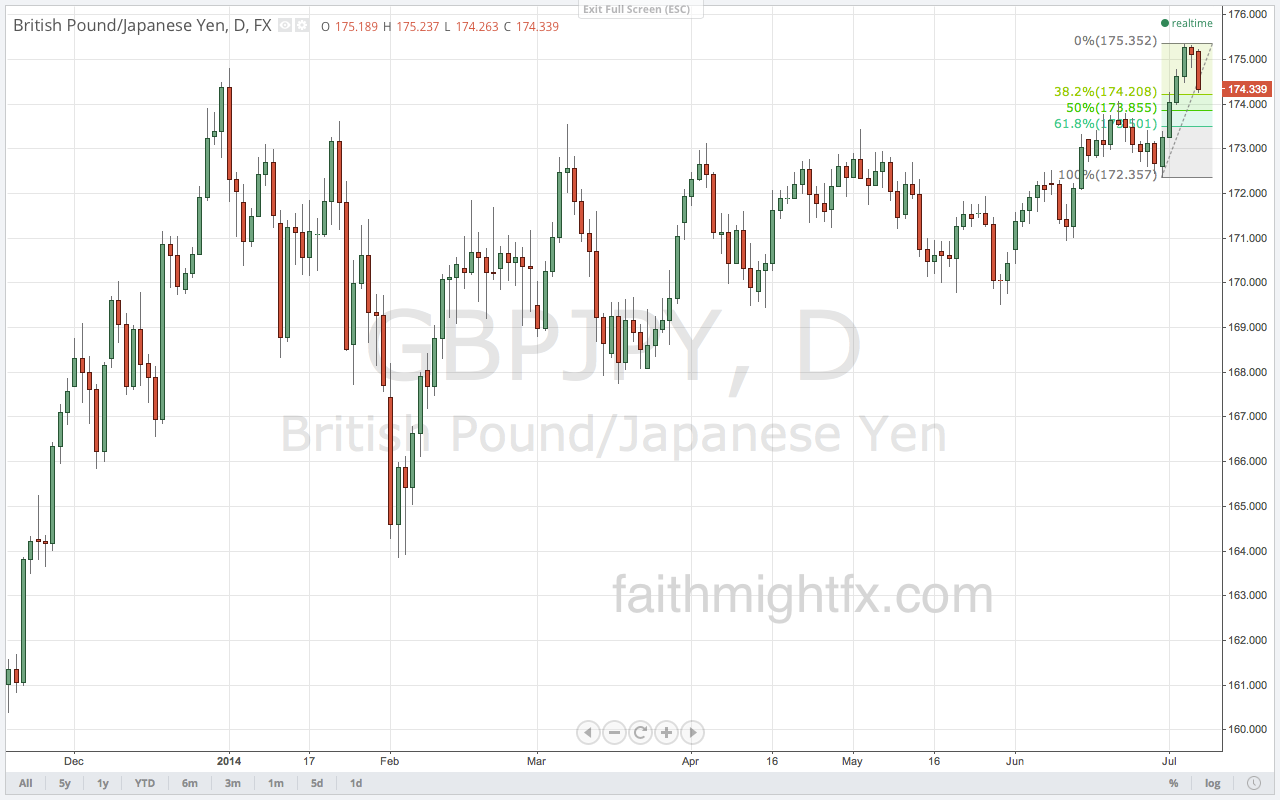
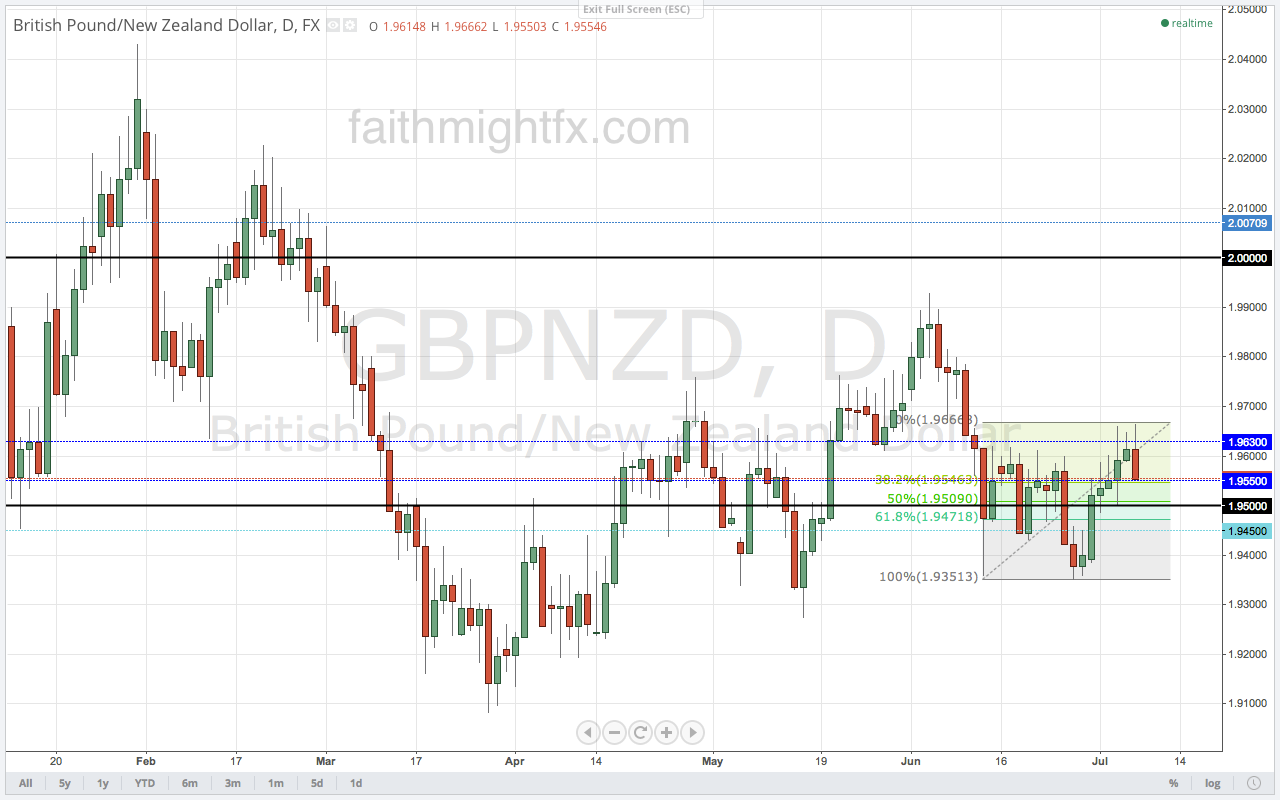
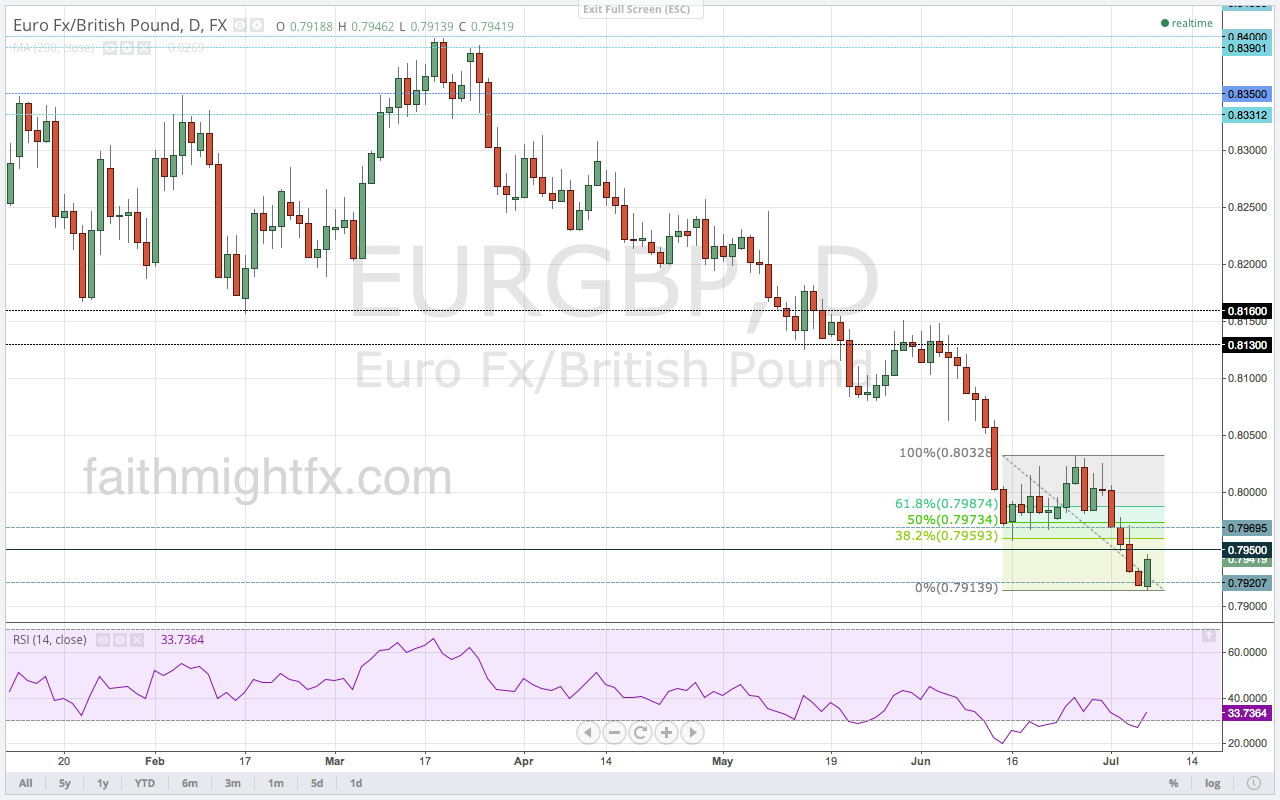
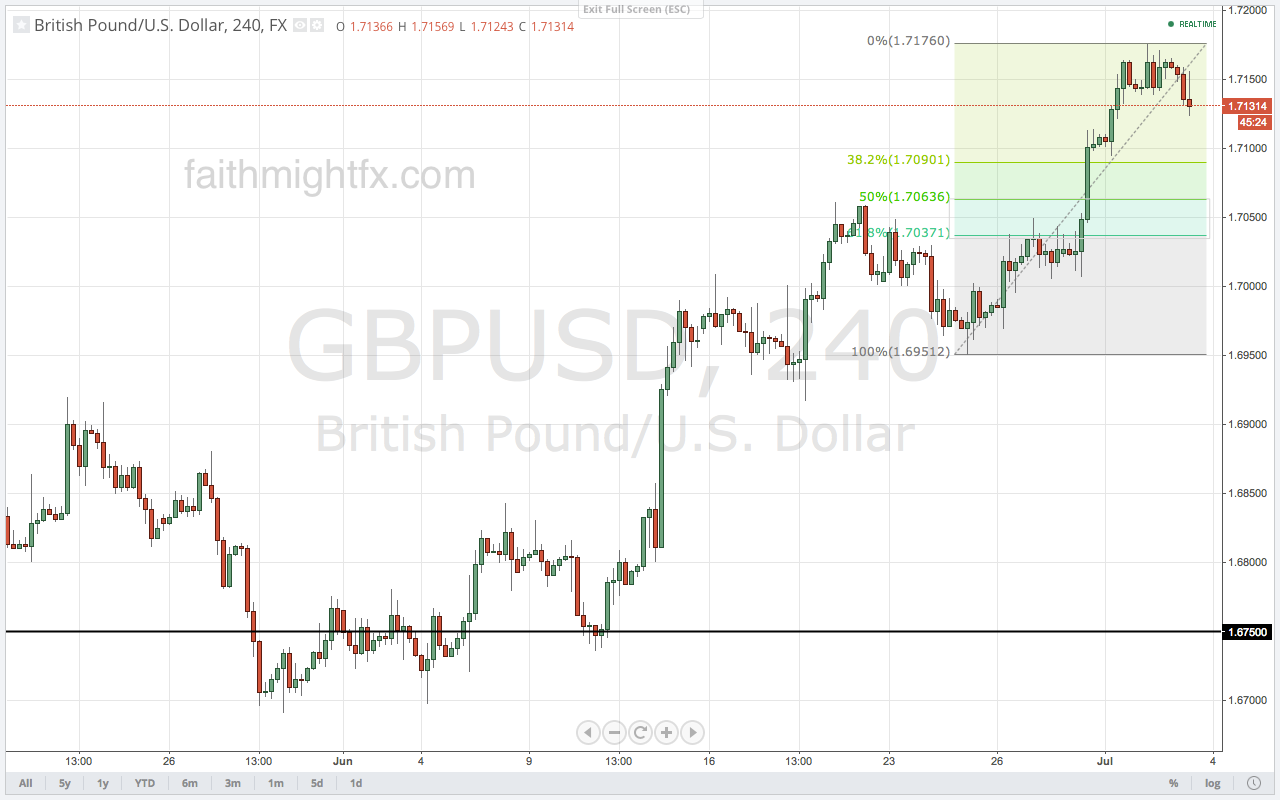
After yesterday, we are headed into FOMC with all the charts still in play. $GBPNZD breached its Fibonacci levels so only support at 1.9350 matters to the downside on more consolidation. All other charts ($GBPUSD, $EURGBP, $GBPJPY) stand. Markets will be light and choppy waiting for the 2pm EST release time. Be aware that some market participants will take advantage of lighter flows and size up their positions. When central banks come to the stage, it is the larger timeframes that really keep you focused on true supply and demand in the market.

Game on. Trade what you see.

Read also:


More Dips, Same Trend

Our first full week of the new quarter and we are greeted to a correction in GBP across the board. With the Bank of England rate decision this Thursday, price action today indicates tons of positioning as market participants take profits and set orders ahead of the announcement.

GBPJPY DAILY CHART


GBPNZD DAILY CHART


EURGBP DAILY CHART


$GBPUSD chart: Healthy Dips Make for Healthy Trends (FMFX)

Trade what you see.


Healthy Dips Make For Healthy Trends

After rallying all week to new highs at 1.7176, $GBPUSD is using the weaker-than-expected Services PMI number this morning the excuse it needs to put in a correction. But don’t be quick to call cable bearish. Nothing moves in a straight line forever and retracements are great to keep a trend healthily intact. Corrections allow new positions into the market as those who missed this move will be looking to join the party. That new demand will only add more fuel to the rally allowing $GBPUSD to move to new highs. By working down the RSI reading, corrections indicate new strength can take us to new highs.

GBPUSD 4 HOUR CHART

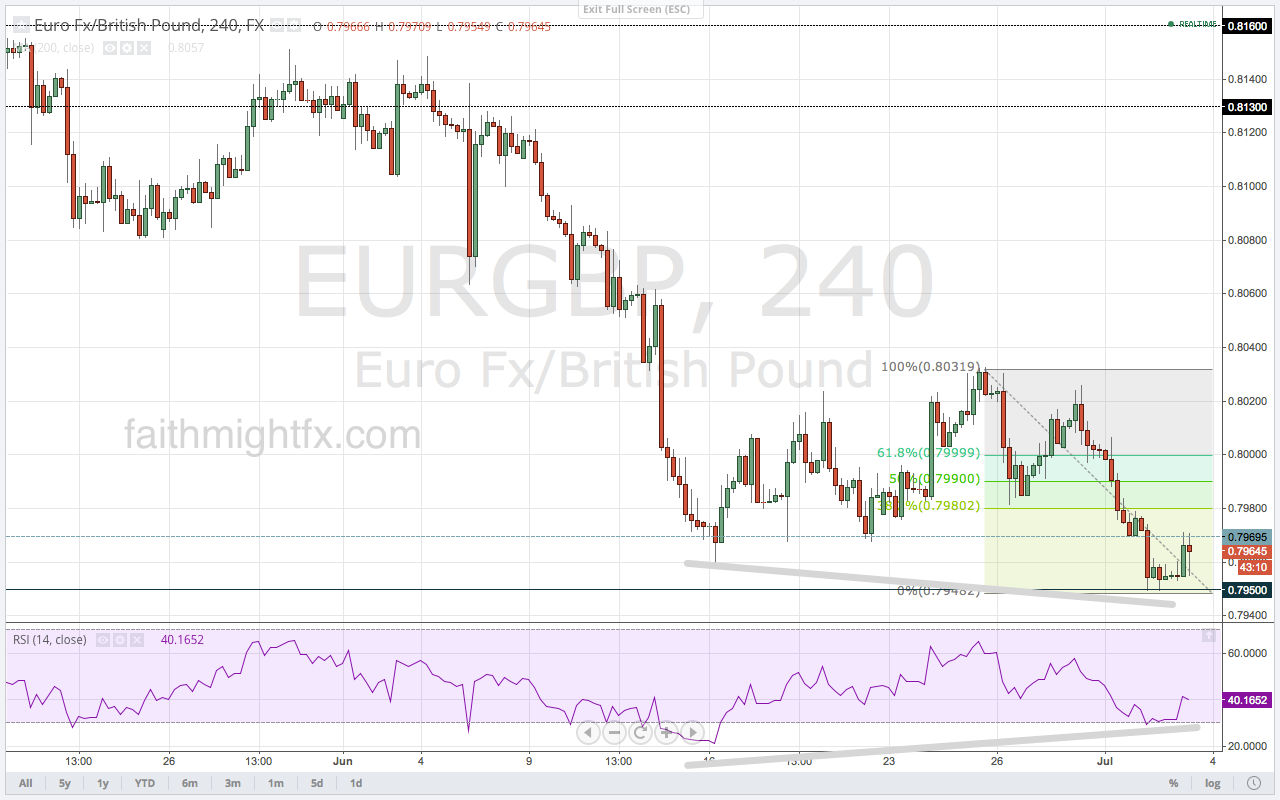
In light of the ECB press conference with Governor Draghi this morning, $EURGBP also has an opportunity to move higher on a correction too. A correction in this pair may give price the strength needed to finally crack the 0.7950 support zone that has stymied the decline in the $EURGBP for the past 2 weeks.

EURGBP 4 HOUR CHART

Big news day today. Don’t get caught up in the knee-jerk reactions. @50pips put it best earlier this morning,

Trade what you see. Read also:


GBP/USD Bull Runs

Sure, $GBPUSD has been rallying for almost a full year now. It has surmounted key psychological levels at 1.60, 1.6250, 1.63, 1.65 and 1.6750 and now the almighty 1.70. When cable closed last week at 1.7027 above the previous highs (1.6996), it was bullish. When the markets were fully open in Monday’s trading session, price surged higher. Though the rally on Monday was mostly explained by month-end and quarter-end fix flows, I had this to say

And, in fact, the data has supported. Today’s data makes a case that not only has manufacturing picked up but is starting to really go strong. Markets like manufacturing so this data looks really good for sterling. And also puts more pressure on the Bank of England to raise rates earlier than they may want. Bullish fundamentals like this will continue to reinforce this strong bull run in $GBPUSD.

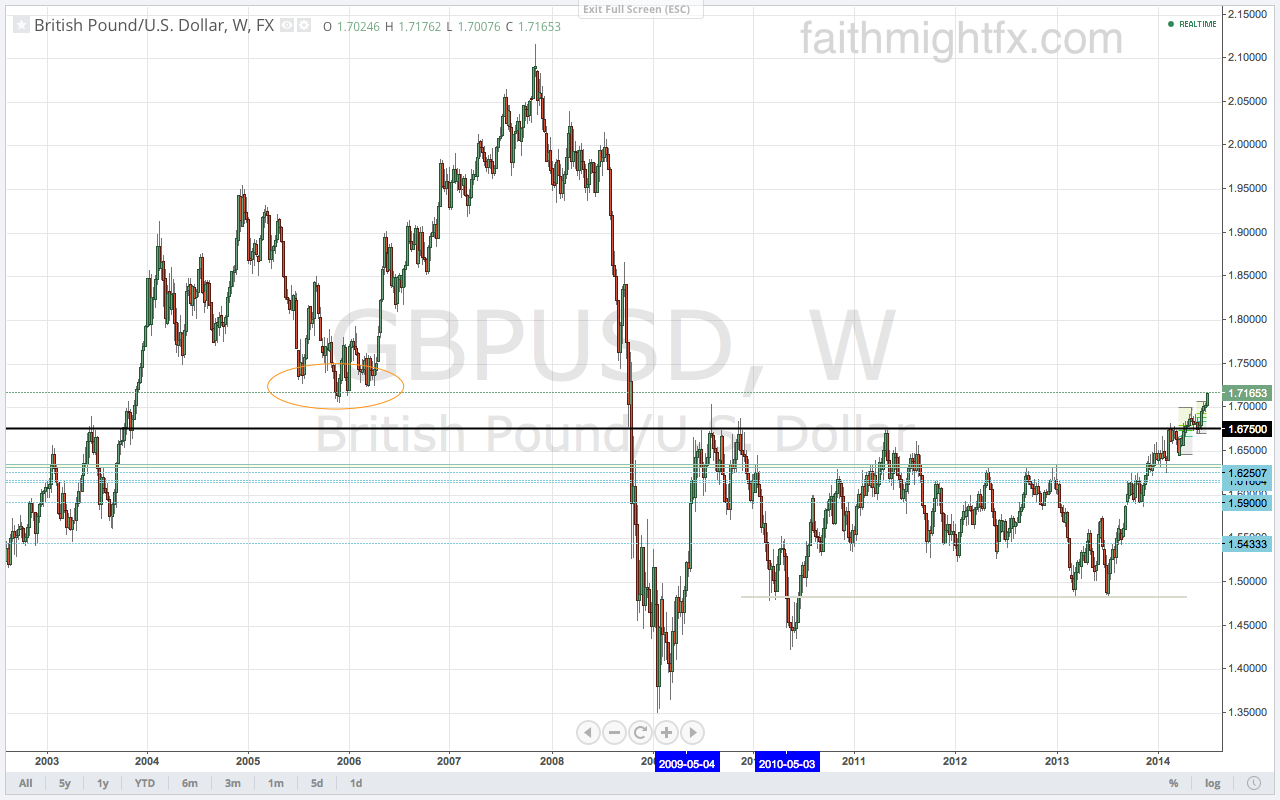
GBPUSD WEEKLY CHART
Green line is current price. Simple support and resistance.

But despite fundamentals, always pay attention to price. Price is banging right up against former lows from (waaay) back in 2005-2006. With the short holiday week, cable may have peaked. Or price could run higher. She can and will do whatever she wants. For many traders who set up before this week, this is and should be a no-risk trade. But as we know, there is no no-risk in the markets. Trade what you see.


What Is A Trading Style

A fellow trader asked:

what do u mean by style long term short term swing trade scalping ? 🙂

For me, trading style ultimately refers to preferred timeframes. Swing traders look at bigger timeframes, typically no less than a 4hour timeframe. A day trader will look at minute timeframes, typically no more than 60 minutes. Of course, the details vary from trader to trader.

A swing trader is comfortable holding a trade overnight and doesn’t want or need to be active in the markets every single day. A swing trader is looking to capture much larger profits on a given position. A day trader couldn’t conceive that. A scalper is very satisfied with smaller profit targets and only wants to be in a position for a few minutes/hours.

Position sizing becomes interesting when you start to look at the 2 distinct styles. Swing traders will typically scale into (and out of) a position to take advantage of the best price the market is giving. Because we are in a position for several days, swing traders take advantage of a market action that provides multiple optimal price points. Scalpers tend to trade their entire position size because they expect to exit the position relatively quickly. So in order to get their desired reward, they are willing to put on their entire position. It seems risky to a swing trader but holding a position for several days seems very risky to a day trader. It’s all about style.

A scalper and swing trader could employ the same trading strategy (Fibs, pivots, support & resistance) but their styles will have very different outcomes. Figure out and trade your style. Most traders pick one. Some traders can trade both ways. Know what works for your personality and lifestyle. Then the hard part: trade thyself.

The Sterling Digest, 27 June 2014: poker face

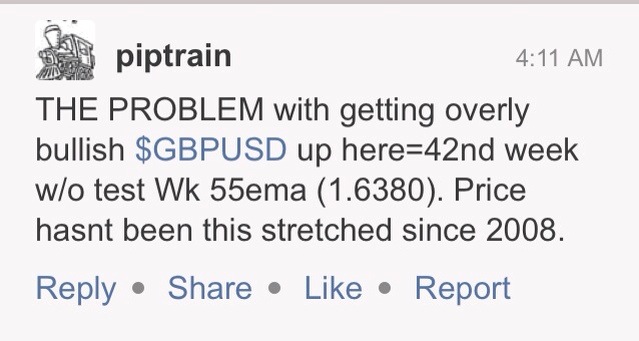
So here we are with $GBPUSD back above 1.7000. It is the first time since 2008 since we’ve traded at these levels. To me, nothing is more bullish than $GBPUSD above 1.70, $EURGBP below 0.80, $GBPAUD above 1.80 and $GBPJPY above 170. But the bears are milling and are suspect of these rallies.

piptrain on stocktwits

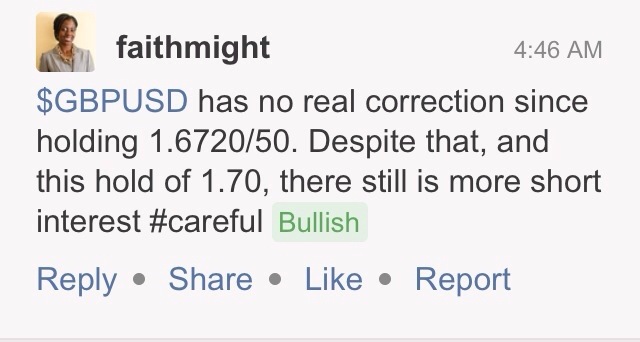
I admit I’m wary too but for another reason. $GBPUSD hasn’t had a decent correction yet.

faithmight on stocktwits

This was Monday. Since then, $GBPUSD has staged a correction to 1.9950 support from the 1.7050 highs. $EURGBP retraced 38.2% to 0.8030 this week. And I think that’s all we will get. Another Friday close above 1.7000 in cable after more remarks from Carney this week is a bullish indication. The fundamental landscape clearly still supports a strong GBP. What can turn the sterling tide? Mark Carney, of course.

Image credit

Sterling Especially Strong Against the Euro

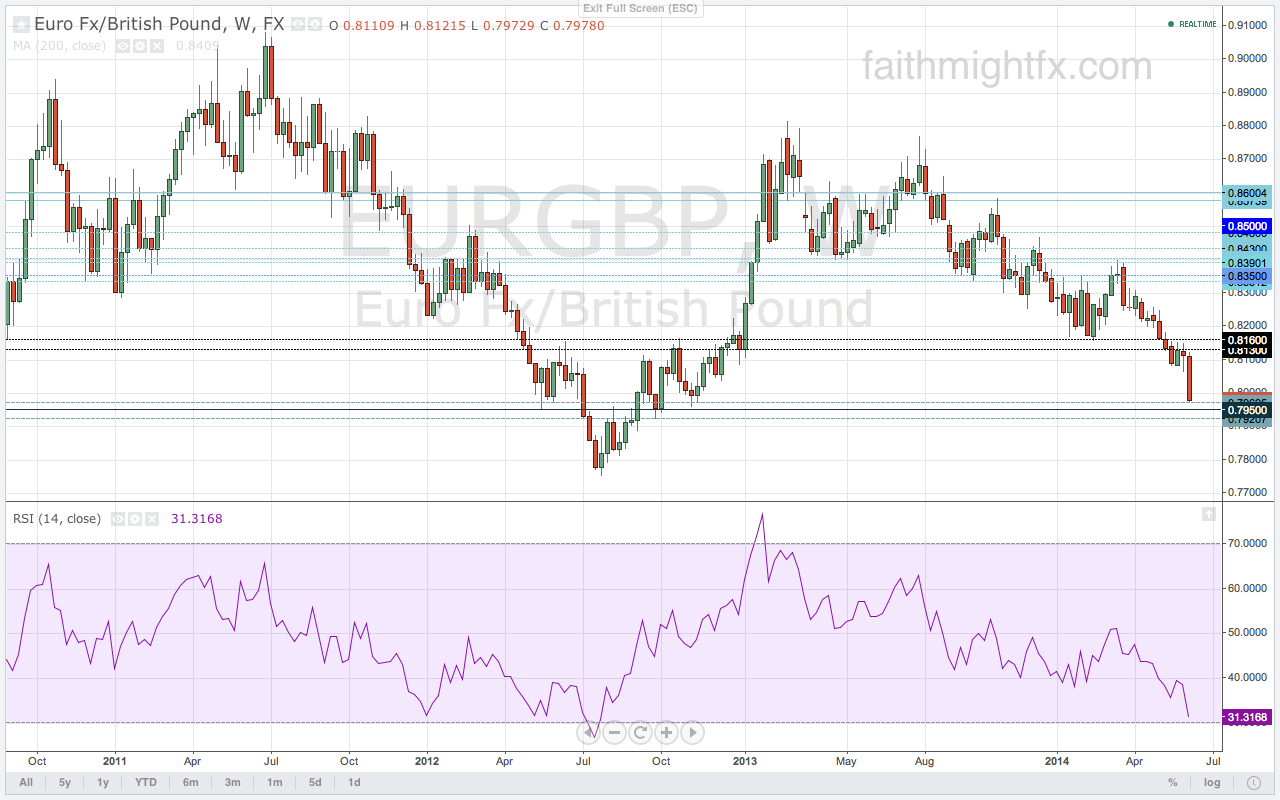
Sterling is on steroids right now. Carney’s comments late Thursday have resonated with the market with a continuation higher against all currencies. But the GBP strength is not anymore pronounced than it is against the euro with the $EURGBP at levels not seen in almost a year.

EURGBP WEEKLY CHART

This full on breakout is approaching a major zone that has acted as both support and resistance with this currency pair. With Carney and Draghi engaging down very different monetary policy roads remarks, the $EURGBP has the sweet advantage of price movement based on double whammy fundamentals. These are the sweet confluences that long-term trends are made of. It is also a good reason to watch the rhetoric because any change in tone from either Draghi or Carney can stop this current bear run dead in its tracks. But until then, expect this zone around 0.7950 to determine direction in the trading sessions ahead.