Sure, $GBPUSD has been rallying for almost a full year now. It has surmounted key psychological levels at 1.60, 1.6250, 1.63, 1.65 and 1.6750 and now the almighty 1.70. When cable closed last week at 1.7027 above the previous highs (1.6996), it was bullish. When the markets were fully open in Monday’s trading session, price surged higher. Though the rally on Monday was mostly explained by month-end and quarter-end fix flows, I had this to say
$GBPUSD wow. If data supports this wk, 1.7250 will not be that far off or crazy of a next target for bulls
— Lydia Idem Finkley (@faithmight) June 30, 2014
And, in fact, the data has supported. Today’s data makes a case that not only has manufacturing picked up but is starting to really go strong. Markets like manufacturing so this data looks really good for sterling. And also puts more pressure on the Bank of England to raise rates earlier than they may want. Bullish fundamentals like this will continue to reinforce this strong bull run in $GBPUSD.
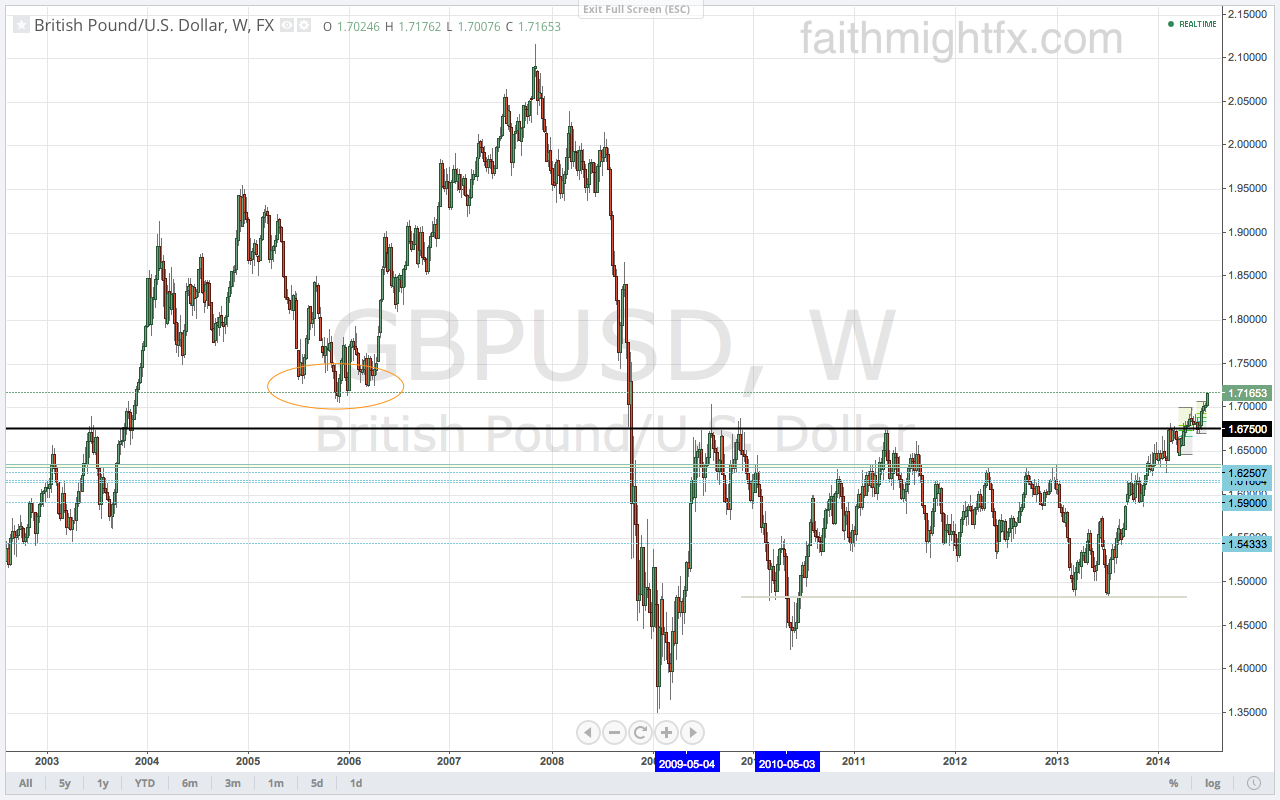
But despite fundamentals, always pay attention to price. Price is banging right up against former lows from (waaay) back in 2005-2006. With the short holiday week, cable may have peaked. Or price could run higher. She can and will do whatever she wants. For many traders who set up before this week, this is and should be a no-risk trade. But as we know, there is no no-risk in the markets. Trade what you see.