Bitcoin opened in 2022 at $46,196. At the end of January 1st, 2022, Bitcoin closed at $47,795. This price is the highest that Bitcoin closed for this year. Since the second day of the year 2022, the bears have been aggressive toward the Crypto king. In the last week of March 2022, the price rallied above the $48,000 psychological level but the price still maintained the highest close of the year at $47,795. While this rally was building up, the bears snuffed out the steam that was brewing in the bulls and dragged the price further downwards.
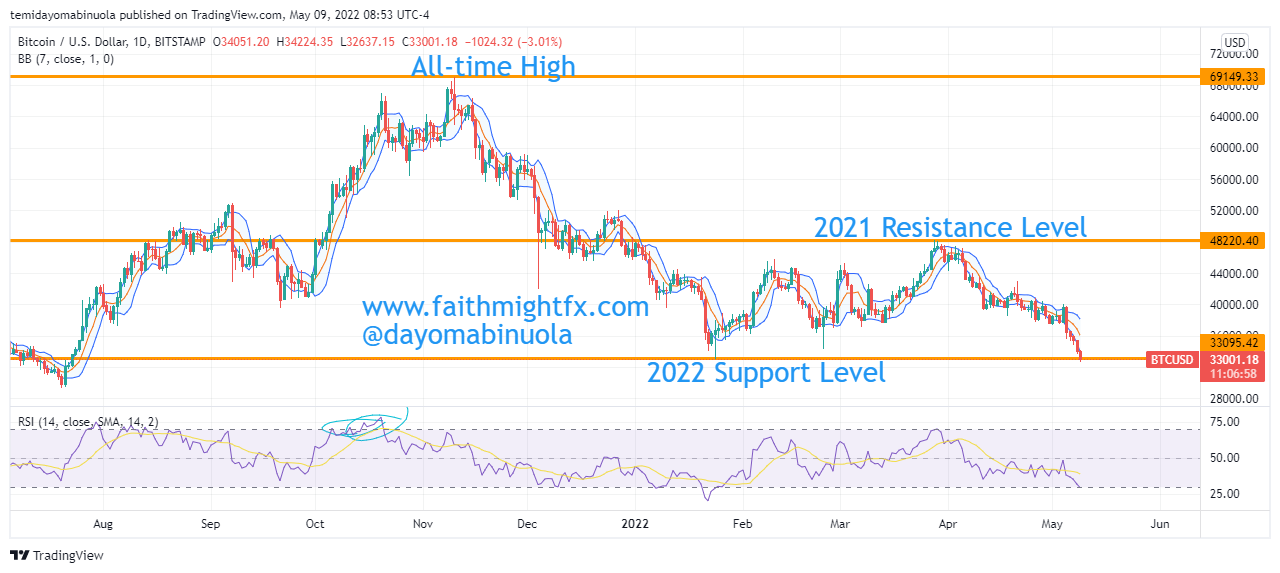
Back in 2021, the price of Bitcoin hit an all-time high of $69,000 in November 2021. Many investors and potential investors were looking forward to investing more at this point as analysts all over the world were forecasting a strong bullish run. But to their greatest surprise (and disappointment), Bitcoin’s bulls couldn’t hold the reins for long and the price began a descent that would last for the next three months. Candlesticks in November 2021, December 2021, and January 2022 all closed on bearish notes.
Earlier in 2021, El Salvador adopted Bitcoin as a legal tender and many analysts were optimistic of Bitcoin’s price reaching $100,000 as they expected other countries to follow in El Salvador’s footsteps. On October 12, 2021, we published an article on the dangers of Bull & Bear Traps. On that day, the price was $57,200. We made a forecast that Bitcoin’s price could go below $30,000. On November 19, 2021, following analysts’ forecast that Bitcoin could hit $100,000, we published another article reinstating our bearish stance. On that day when we published the article, the price was $58,229. Our analysts, however, were confident in the forecast that was made and we stuck to our prediction.
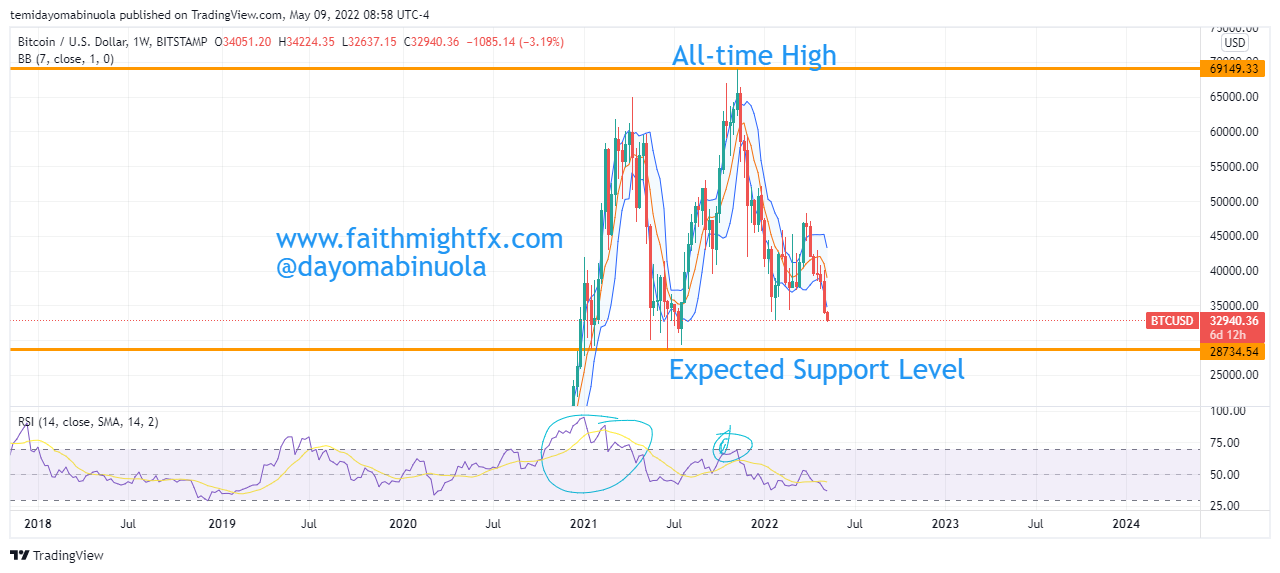
At the beginning of May, Bitcoin opened at $37,664 to reach May’s high of $40,000. But the past 7 days have been in favor of the bears and BTC has dipped below $33,000 making it hit the lowest point of the year at $32,670. Bitcoin’s current move is in perfect alignment with our forecast for Q4 2021 and we still stick to the call that BTC will go below $30,000.
Some of these ideas are in our clients’ portfolios. To understand if this one can work for you or for help to invest your own wealth, talk to our advisors at FM Capital Group. Would you like more information on how to get stocks in your portfolio? Schedule a meeting with us here.