Nike stock, for the most part of its lifespan on the New York Stock Exchange, has been an Investor’s Paradise. It has been able to achieve over 8X since it went public in 1980. The apparel & footwear giant hit its all-time high in November 2021 at $178. Between November 2021 and March 2022, Nike took a dramatic fall downwards to $116, a $62 loss, leading to a new support level at that same $116 price mark.
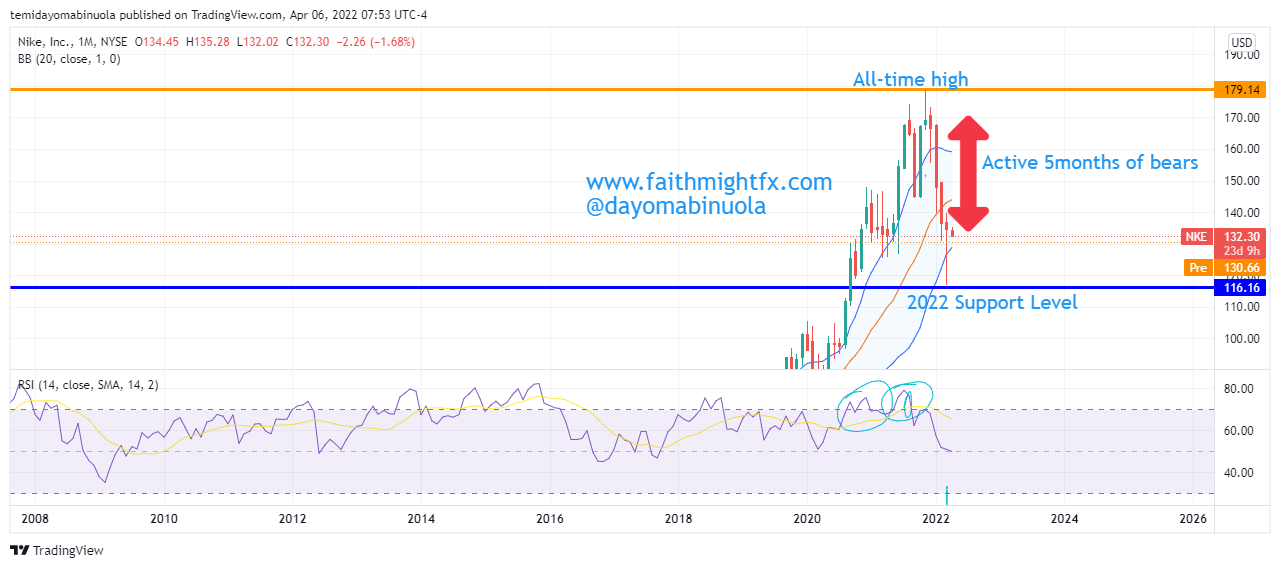
There are indications of the price being oversold on the RSI weekly chart. Analyzing the candlestick formations, the candlestick on the week of March 14 forms a bullish engulfing pattern which consequently wipes out the bearish momentum of the previous candlestick on the week of March 7 (see yellow circle). This means that a bullish run could be underway in a few weeks.

This rally – if it occurs – could fill up the gap-down that occurred earlier in the year between the weeks of January 3 and January 10 respectively. Price could ride this bullish wave to hit $171 although the price is currently in the lower region of the Bollinger Bands and is still gathering momentum.
Some of these ideas are in our clients’ portfolios. To understand if this one can work for you or for help to invest your own wealth, talk to our advisors at FM Capital Group. Would you like more information on how to get stocks in your portfolio? Schedule a meeting with us here.