Etsy is an American Vintage e-commerce company focused on handmade and vintage items and craft supplies. Etsy was founded 16 years ago and went public about 7 years ago at $16. On the day of the IPO, the share price rose by 72%. After 9 months of its launch on the stock exchange, it took a bearish turn and hit an all-time low at $6.04.

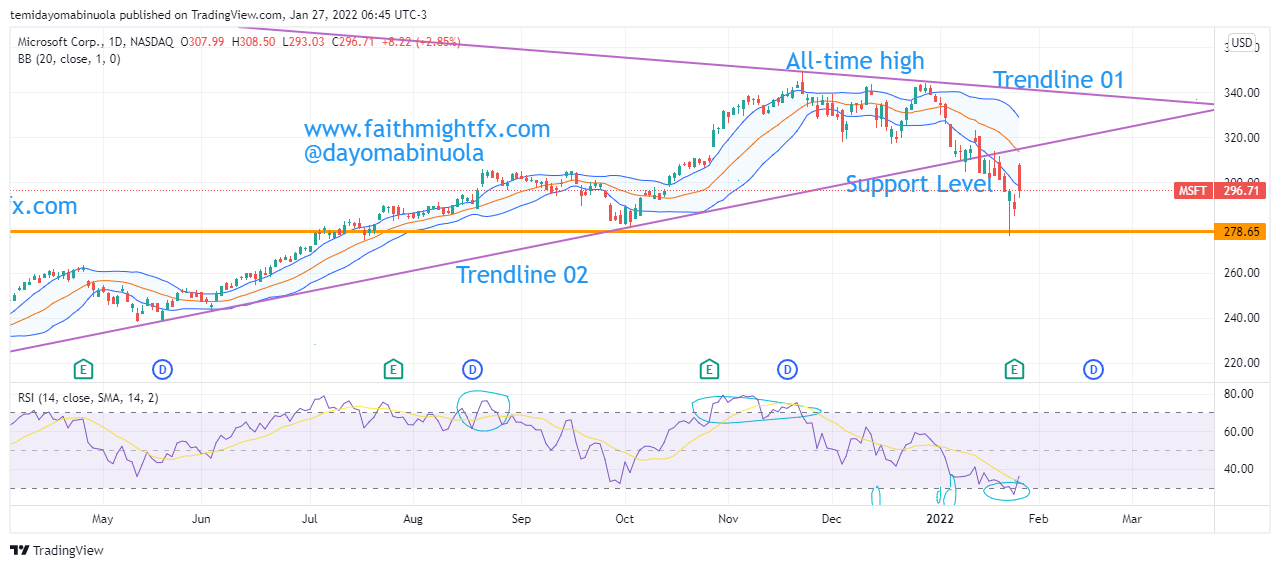
From January 2016, $ETSY share price took off in the bullish wave. In November 2021, Etsy’s price reached a new all-time high at $308.96. That high reflected on the RSI as an “overbought” indication. Following that all-time high, the share price fell and so far, the share price has lost 65% of the price of the all-time in November 2021. The most recent price dip did not indicate oversold on the RSI despite the 65% fall in price. The crisis between Russia and Ukraine has not really affected the US stocks as $ETSY has been appreciating from the new low at $108.53 for the past two weeks. This appreciation could lead to a long-term rally that could see $ETSY gaining 100 points.

Some of these ideas are in our clients’ portfolios. To understand if this one can work for you or for help to invest your own wealth, talk to our advisors at FM Capital Group. Would you like more information on how to get stocks and commodities in your portfolio? Schedule a meeting with us here.