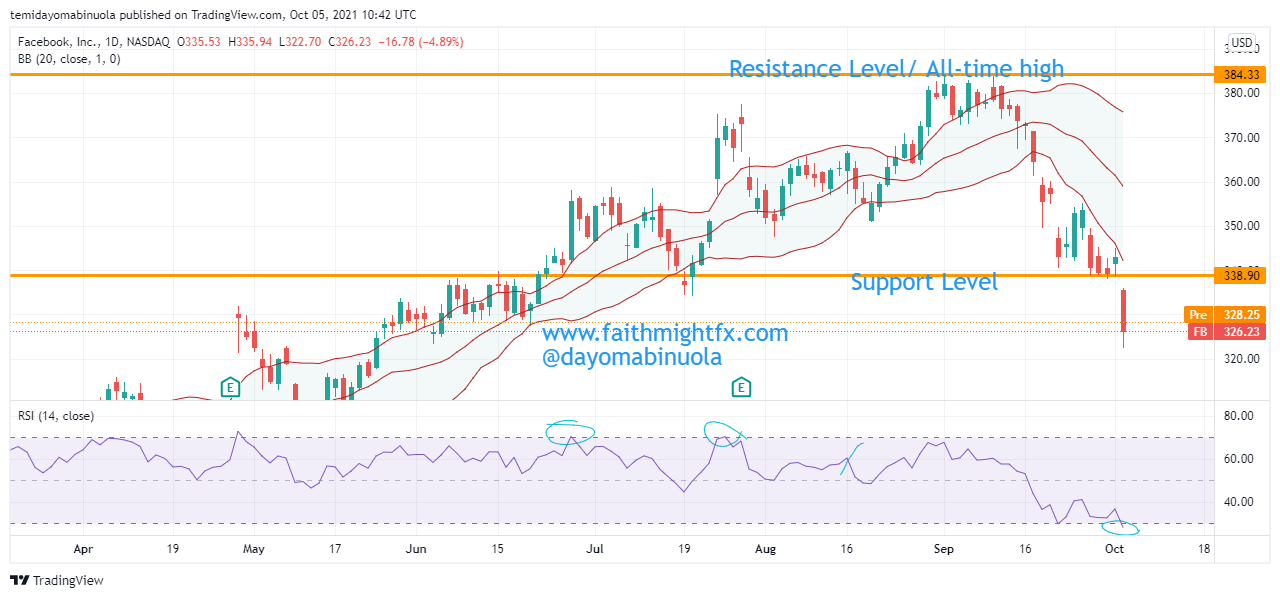
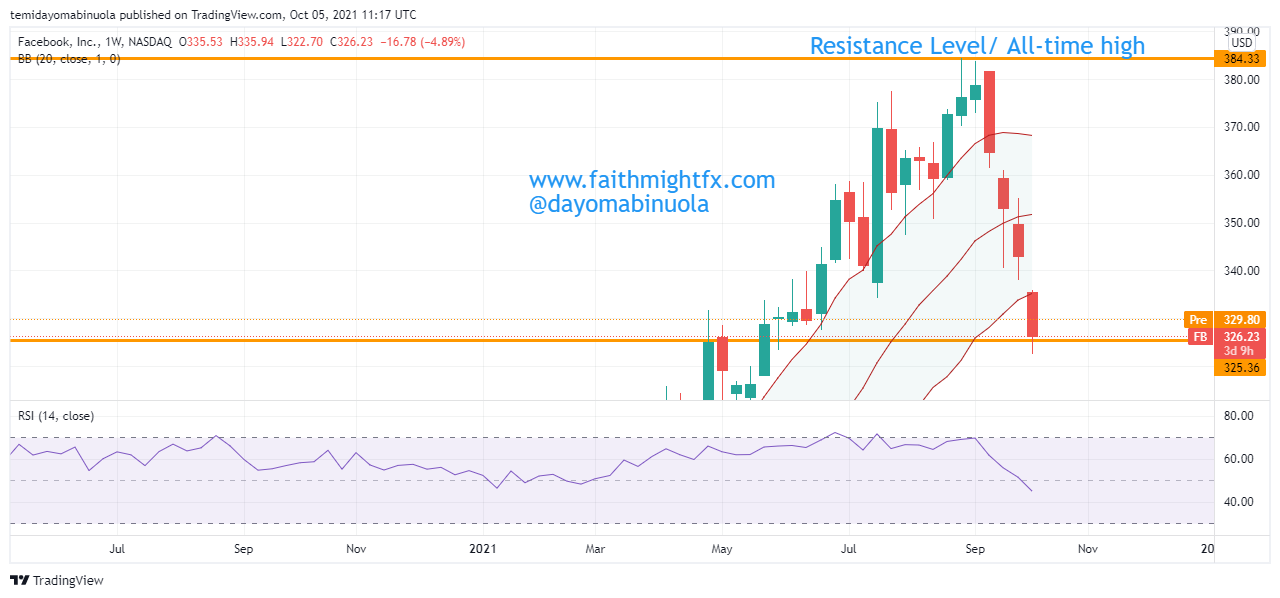
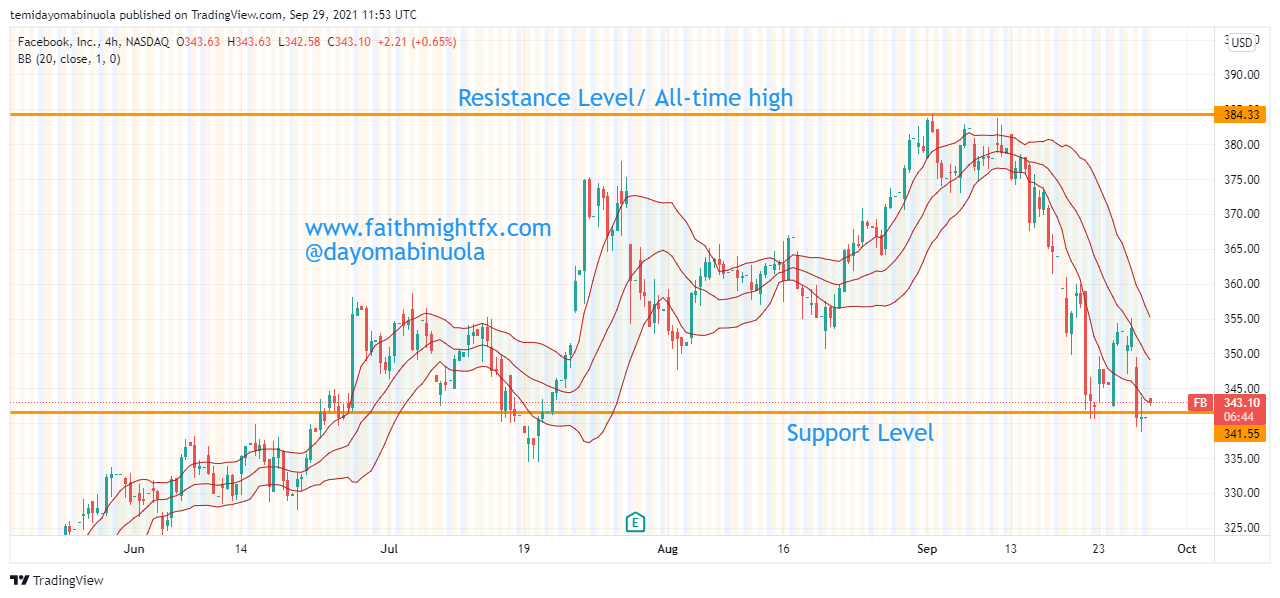
Facebook Inc has been in the middle of a crisis for a while, which has negatively affected the share price since the beginning of September. On the 28th of September, Facebook Inc changed its name to “Meta Platform Inc”. There is a new technology named metaverse, which is termed surround-yourself technology, the CEO is committed to developing the technology, which I believe must be one of the reasons for the name change. The social network name is still called Facebook. Also, the leadership of Facebook Inc remains unchanged.
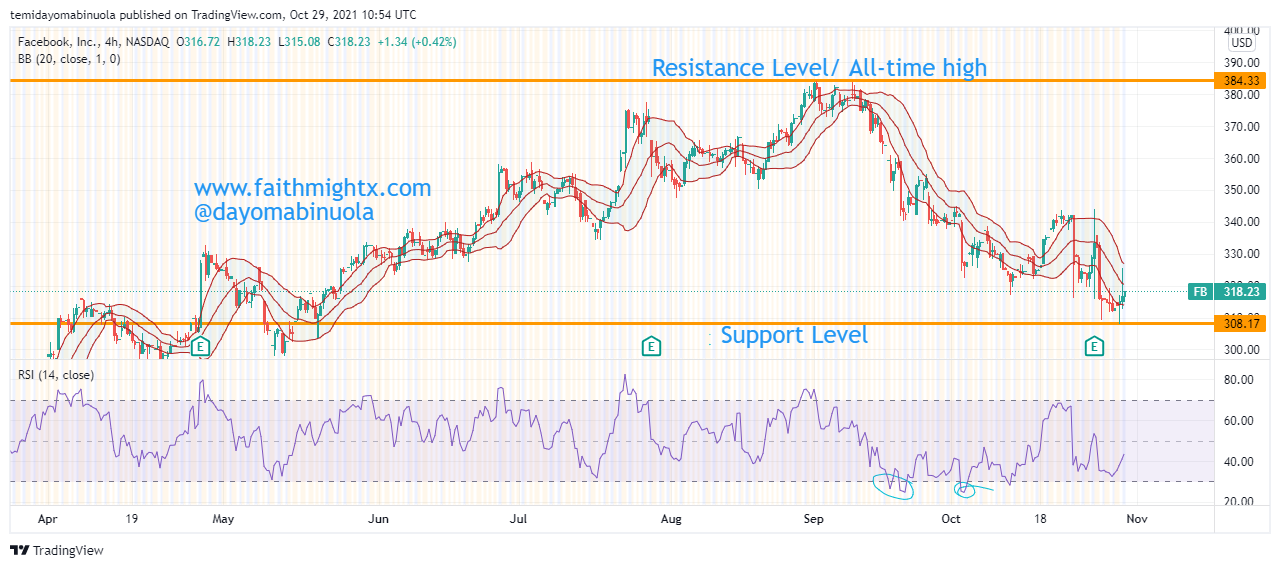
The metaverse brings the internet to life or is rendered in 3D. Zuckerberg has described it as a “virtual environment” you can go inside of, instead of just looking at it on a screen. People can meet, work and play, using virtual reality headsets, augmented reality glasses, smartphone apps, or other devices. It has been said that Facebook will spend $10billion this year on the new technology. RSI has shown two oversold positions in September and October on the 4hour chart, after the dip in September. An upward breakout of the trendline occurred this October before the dip continued to reach new support at $308.17. The price movement shows the bulls broke the trendline again. With the introduction of the metaverse, Facebook might begin a major bullish movement back to the all-time high at $384.33
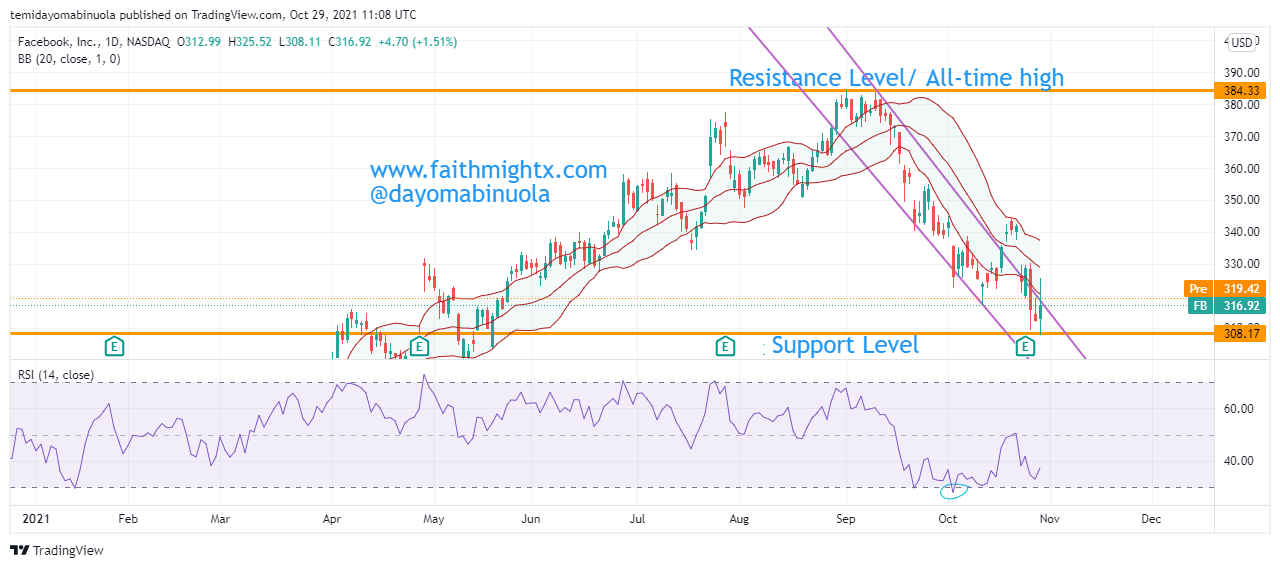
The Daily chart shows it clearly that all profits made in the second half of this year have been lost as a result of the recent dip in September. Yesterday ended a bullish note as the Facebook name was changed to Meta.