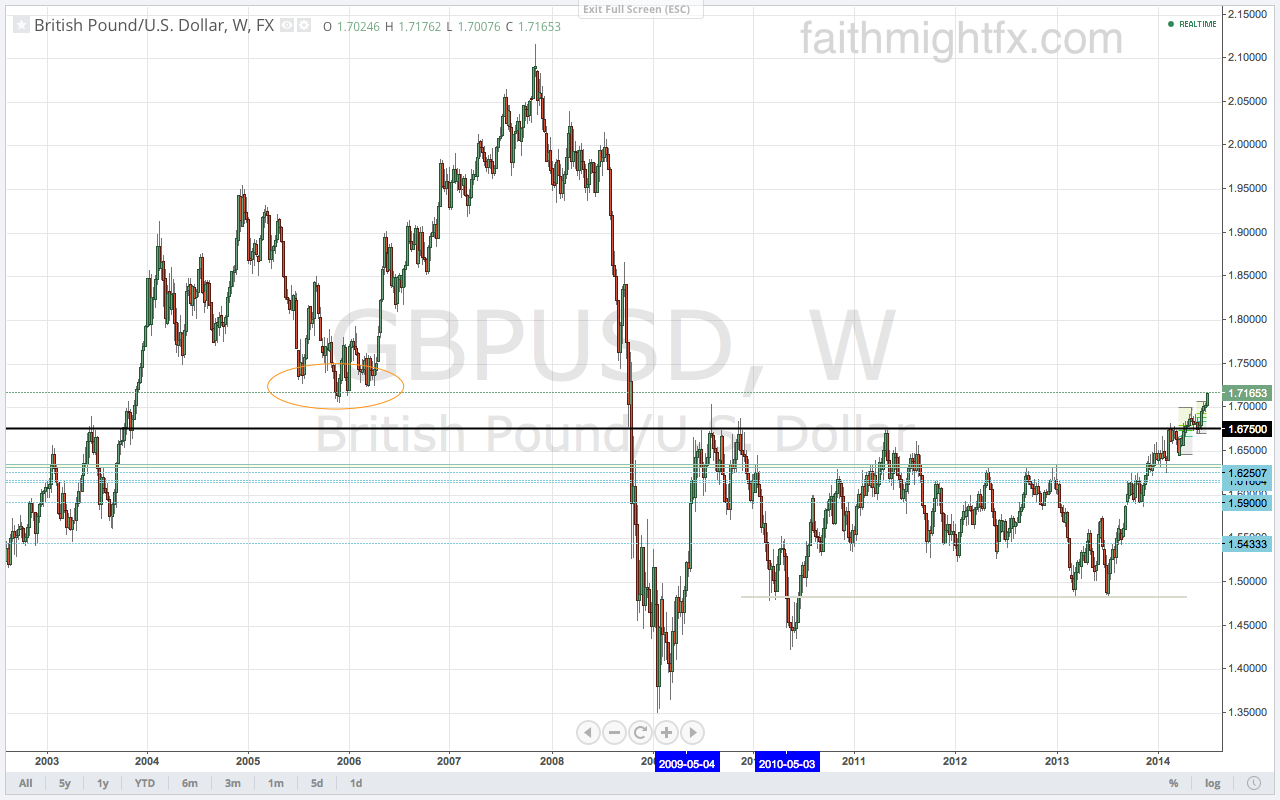
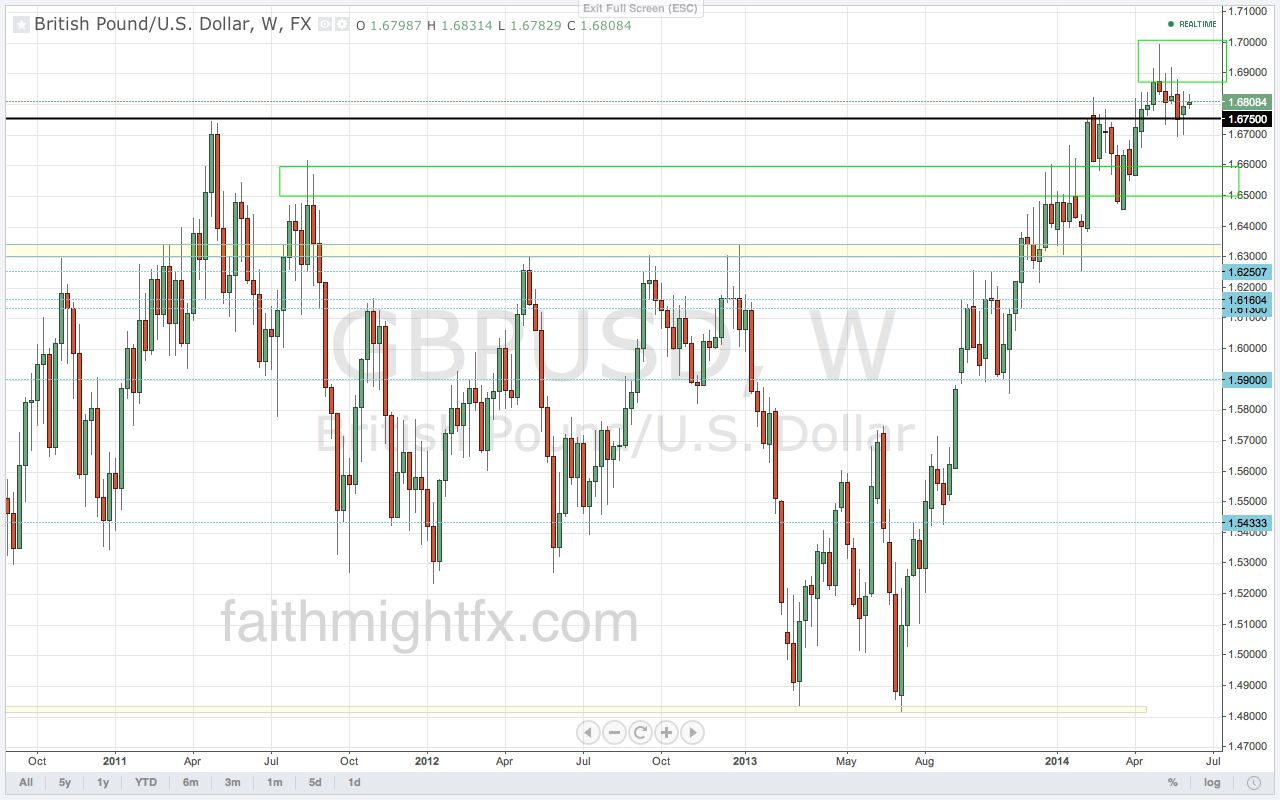
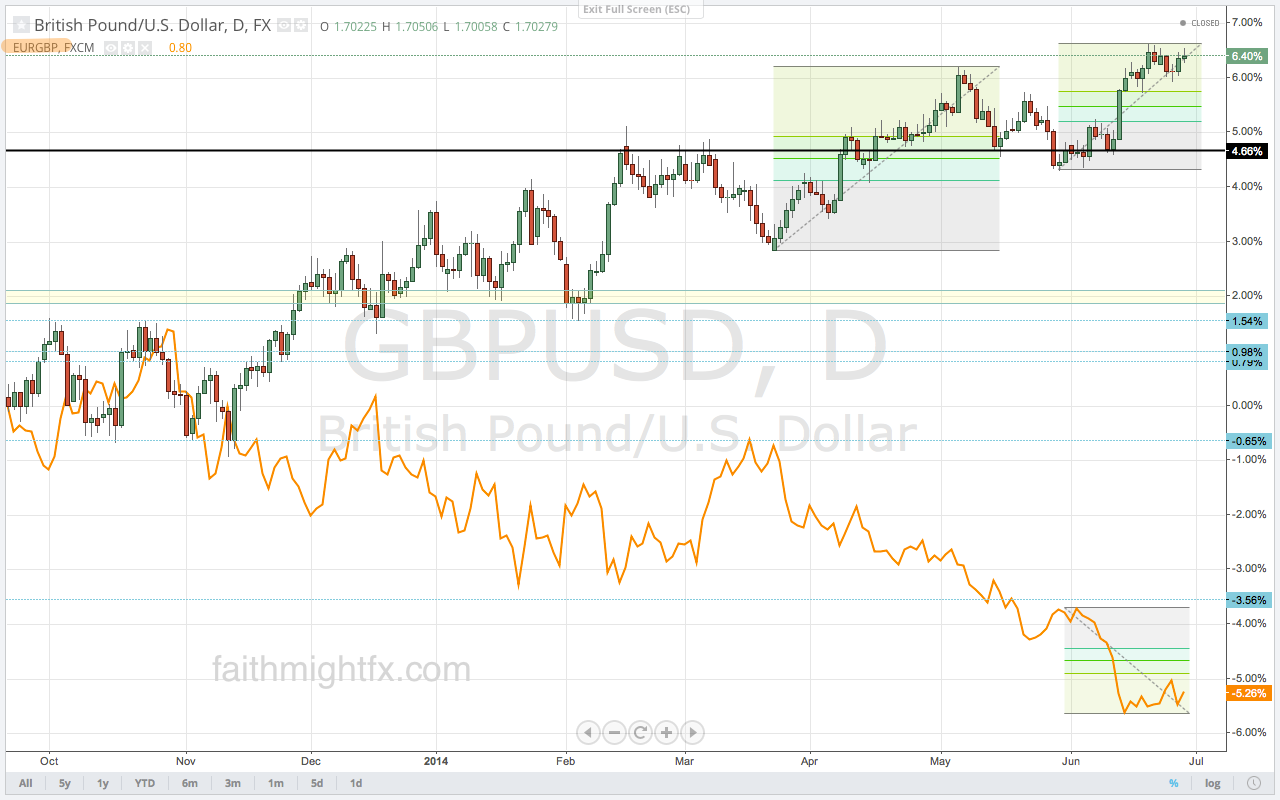
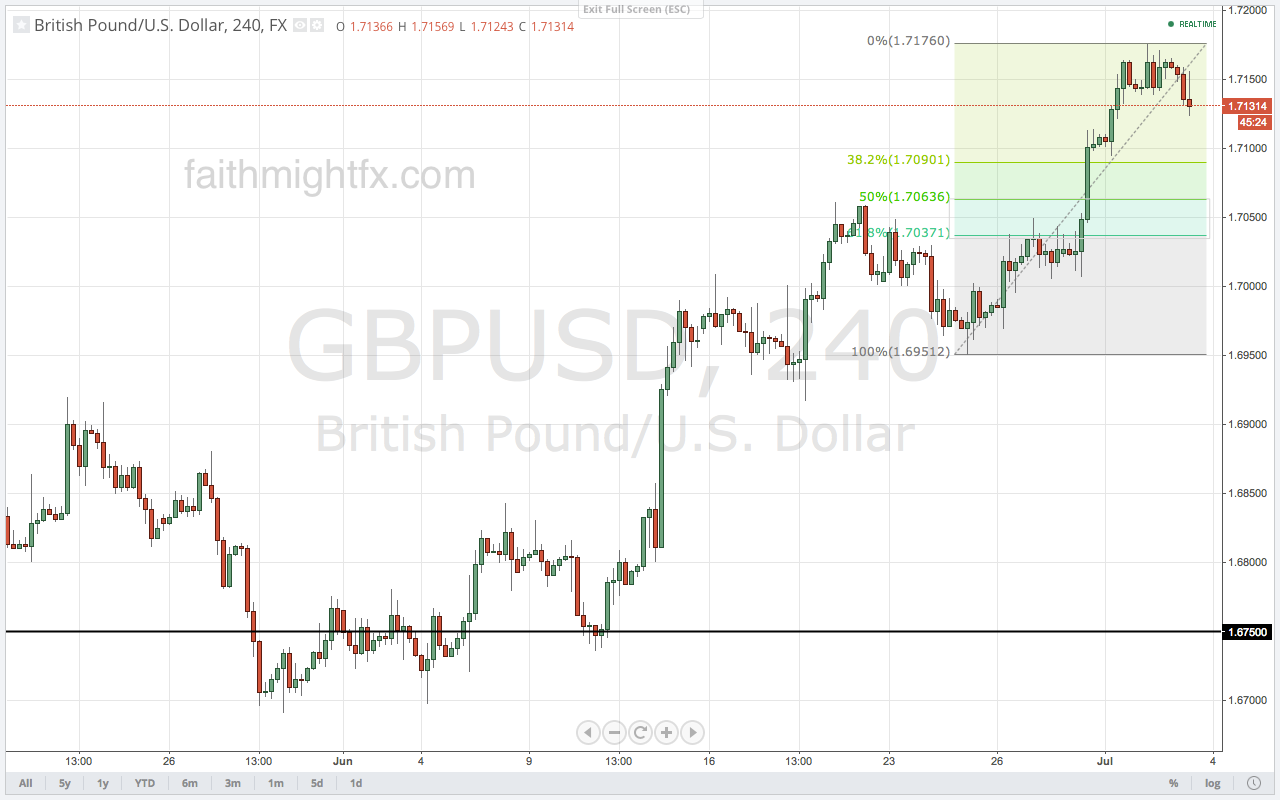
After rallying all week to new highs at 1.7176, $GBPUSD is using the weaker-than-expected Services PMI number this morning the excuse it needs to put in a correction. But don’t be quick to call cable bearish. Nothing moves in a straight line forever and retracements are great to keep a trend healthily intact. Corrections allow new positions into the market as those who missed this move will be looking to join the party. That new demand will only add more fuel to the rally allowing $GBPUSD to move to new highs. By working down the RSI reading, corrections indicate new strength can take us to new highs.
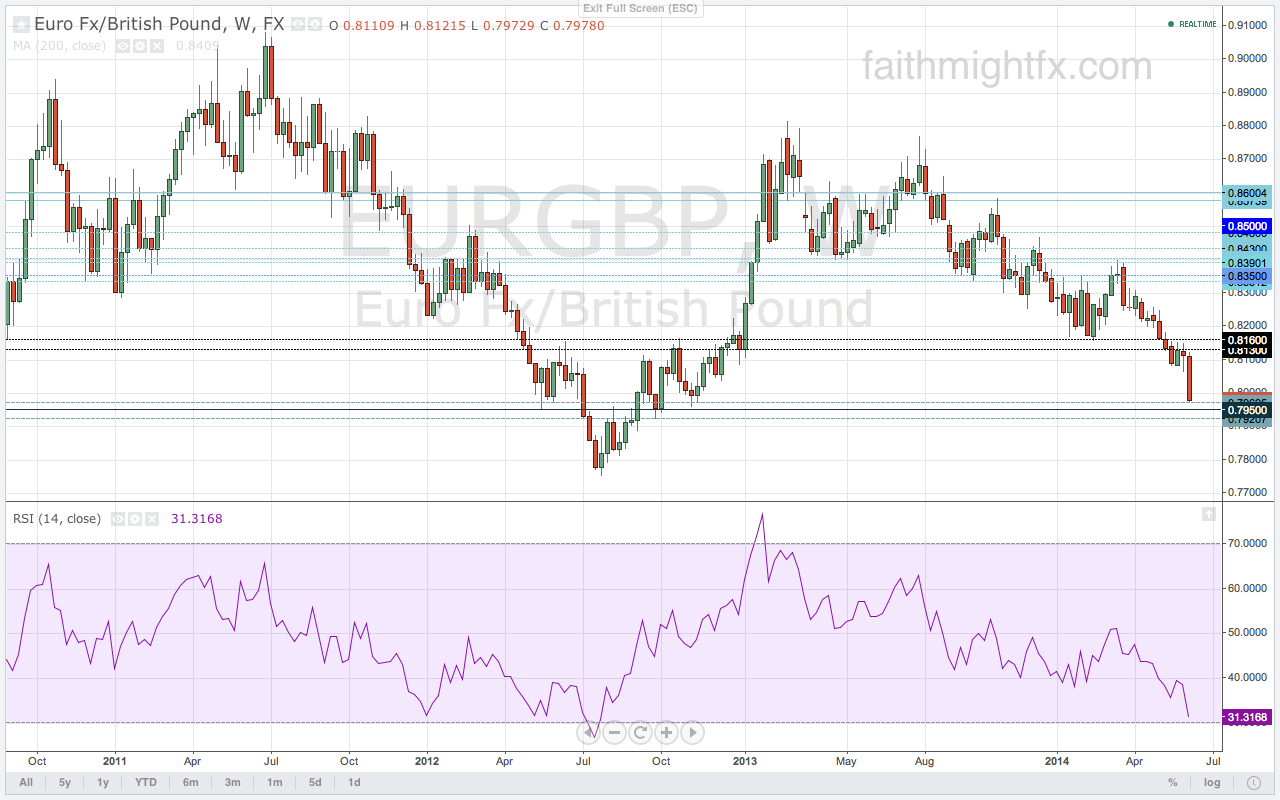
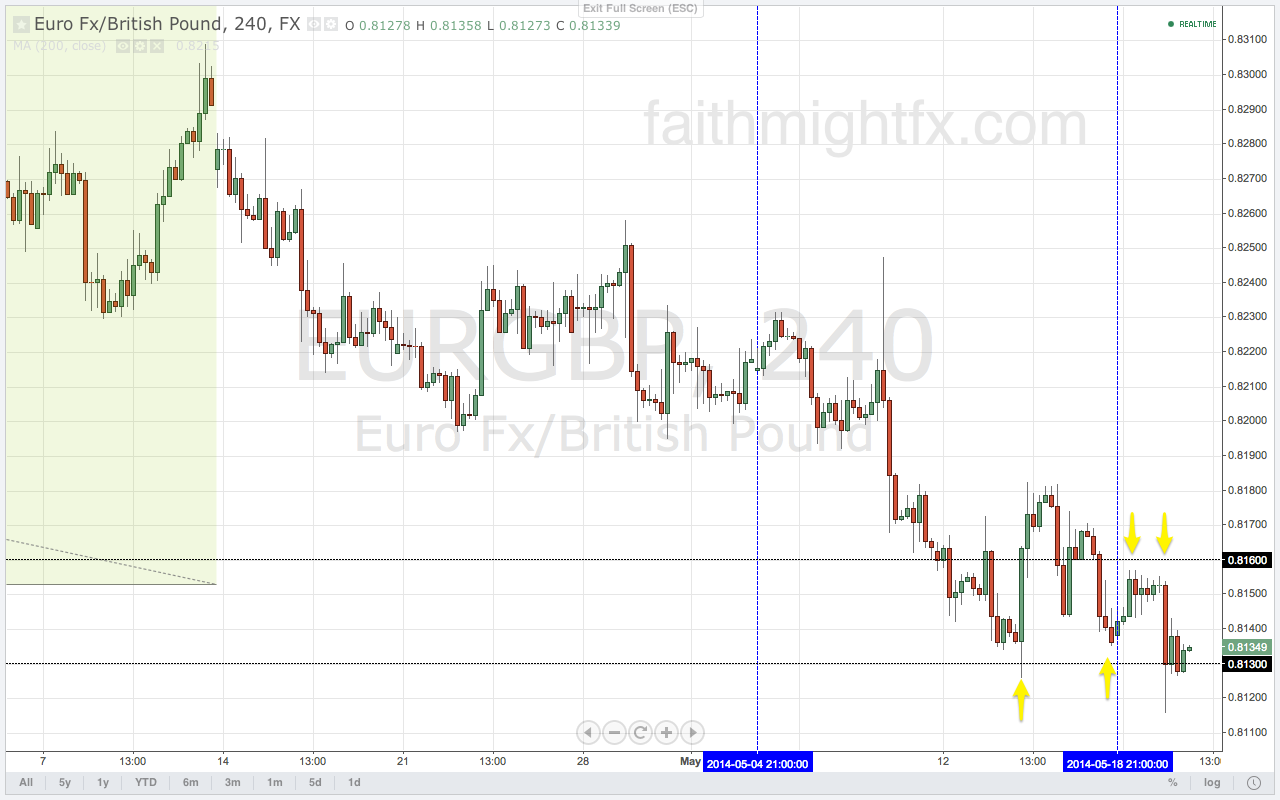
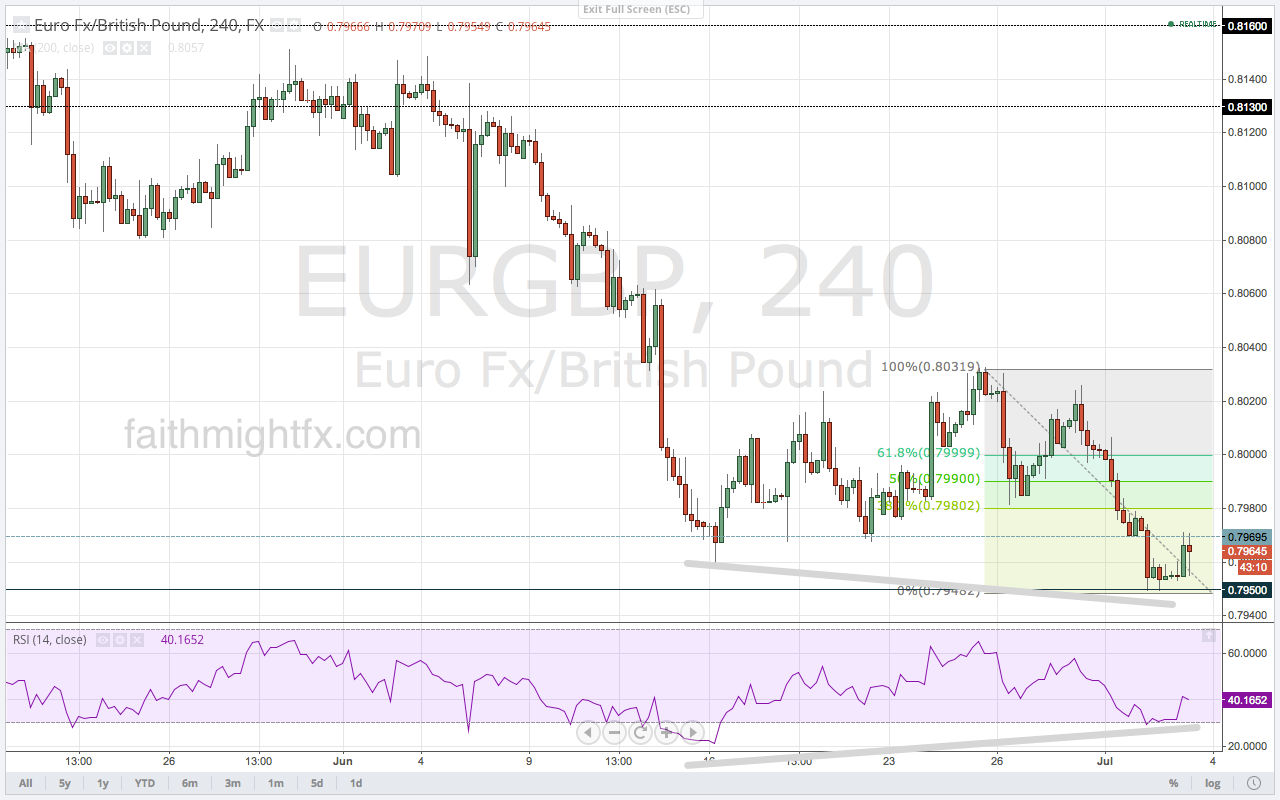
In light of the ECB press conference with Governor Draghi this morning, $EURGBP also has an opportunity to move higher on a correction too. A correction in this pair may give price the strength needed to finally crack the 0.7950 support zone that has stymied the decline in the $EURGBP for the past 2 weeks.
Big news day today. Don’t get caught up in the knee-jerk reactions. @50pips put it best earlier this morning,
heads up, should be a volatile rest of the day. no need to be a hero, focus on setups and don’t be the one chasing the moves… — 50 Pips (@50Pips) July 3, 2014
Trade what you see. Read also:
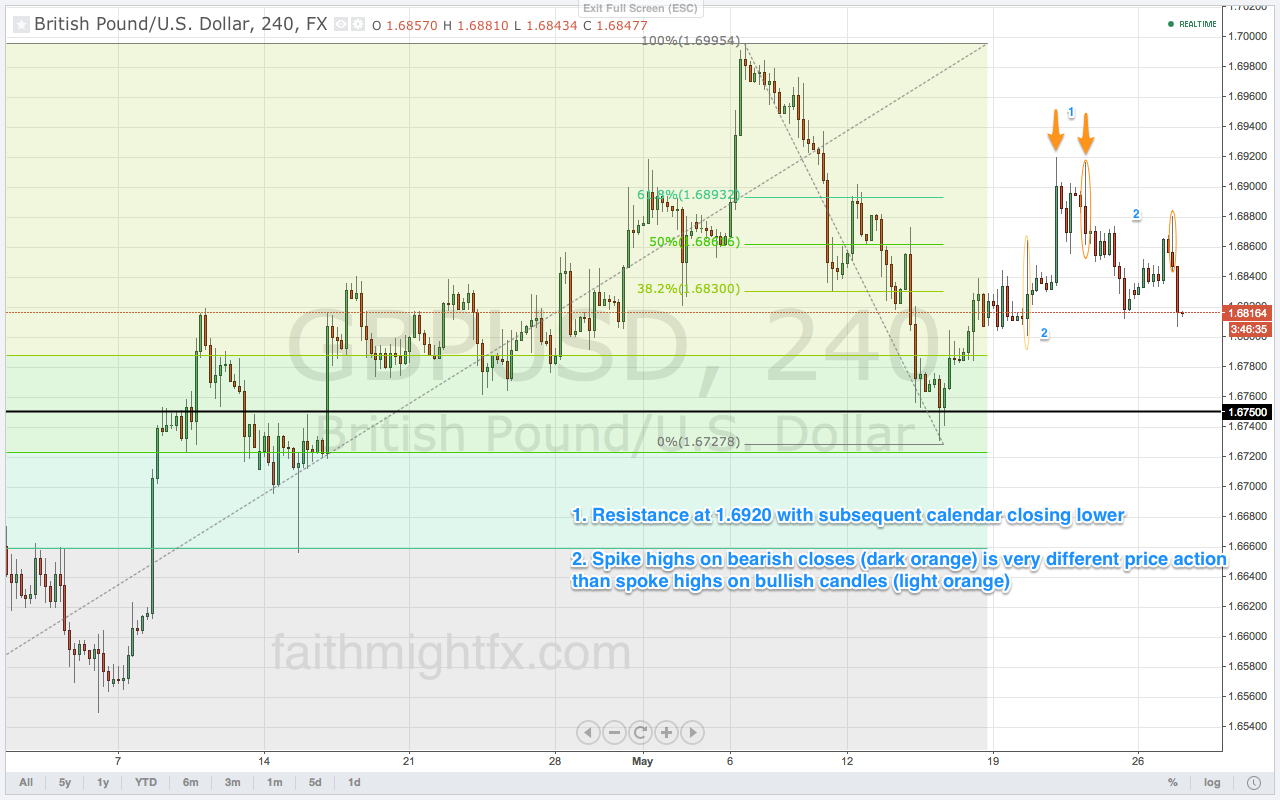
- GBP/USD Bull Runs (FMFX)
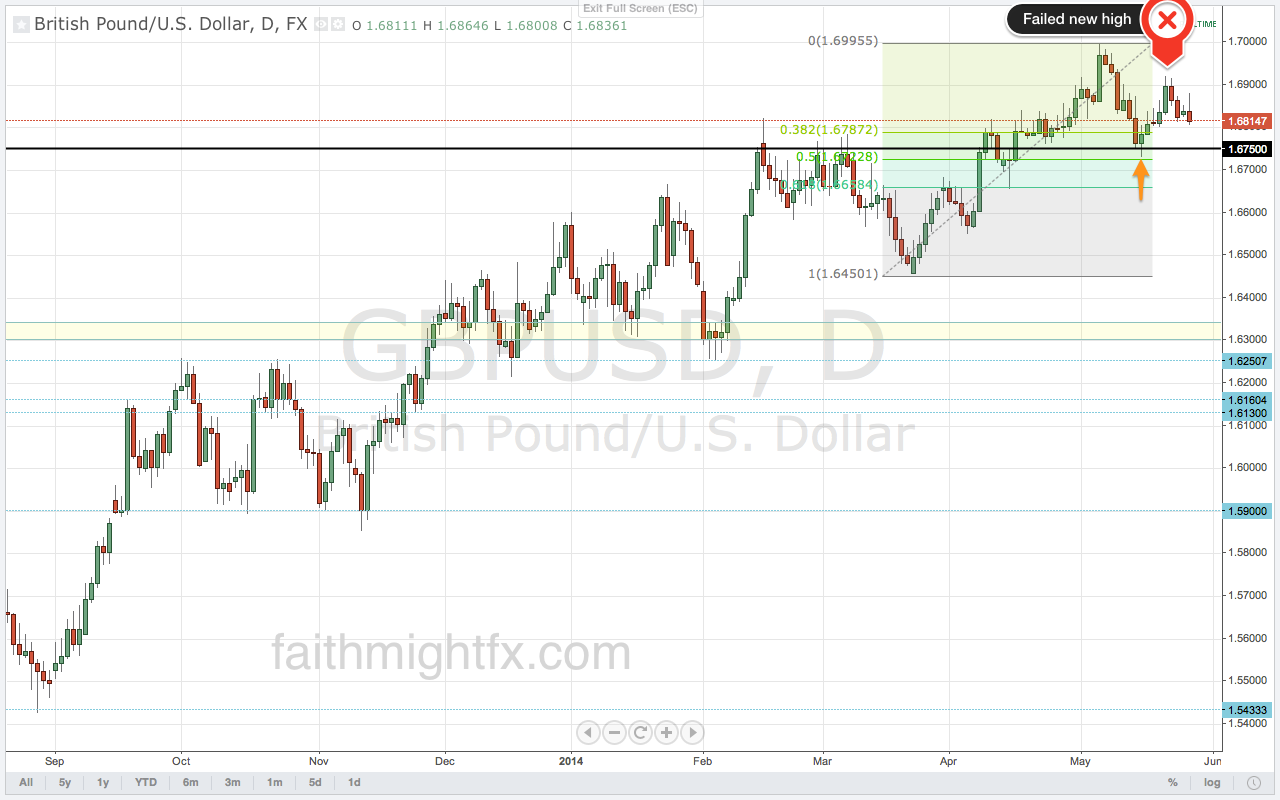
- Sterling Especially Strong Against Euro (FMFX)