Category: Commentary

  • Big Deal

    Friday’s close below 1.60 is a big deal for bears. It marks its first close below 1.60 after rallying for nearly 4 consecutive weeks.

    GBPUSD monthly chart

    Zooming in a bit to a weekly chart, we can see that a Friday close below 1.60, in most cases, led to a continuation lower.

    GBPUSD weekly chart

    It is also particularly bearish that the recent rally put in a lower high at 1.6250 than the previous 1.63 top. Perhaps cable will break out of this massive consolidation pattern after all and lead us back to 1.35. Before then, however, the Fibonacci levels on the weekly chart provide a 1st area of support and decision-making for bulls and bears.


  • What PMI Week Tells Us

    You cant make someone change from being either a lefty in denial or a miserable pessimist (ukipers) that dont want a recovery. I for one will enjoy the upturn and reap the benefits with my company as I can already see. Must go work to do

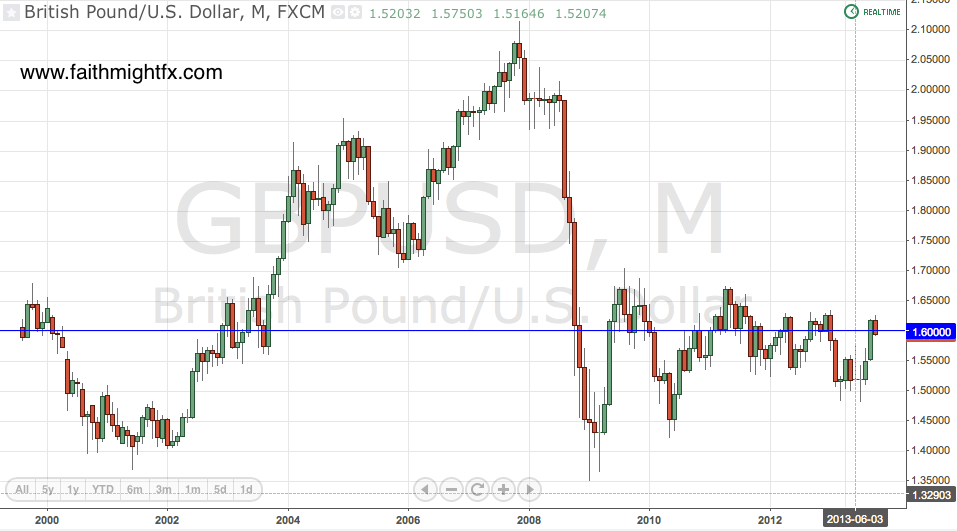
    The above quote is a comment on an article in the Telegraph yesterday that the UK economy is recovering at the fastest rate in the world. During the summer, the UK economy showed some great numbers from all sides of its economy. Construction and manufacturing were buzzing, consumers were spending and house prices were rising. From June through August, services PMI numbers surprised to the upside. Even construction and manufacturing had some very robust months which becoming a great sign of recovery as these sectors in particular suffered tremendously during the Great Recession.

    [table id=2 /]

    While this week’s PMI numbers may have missed expectations, these are some strong PMI numbers. All numbers are nicely above 50 indicating a very robust recovery in the UK. In fact, the September numbers were revised upward since 1st reported a month ago. It looks as though the fundamentals have come to reflect what price action has been telling us for the past few months.

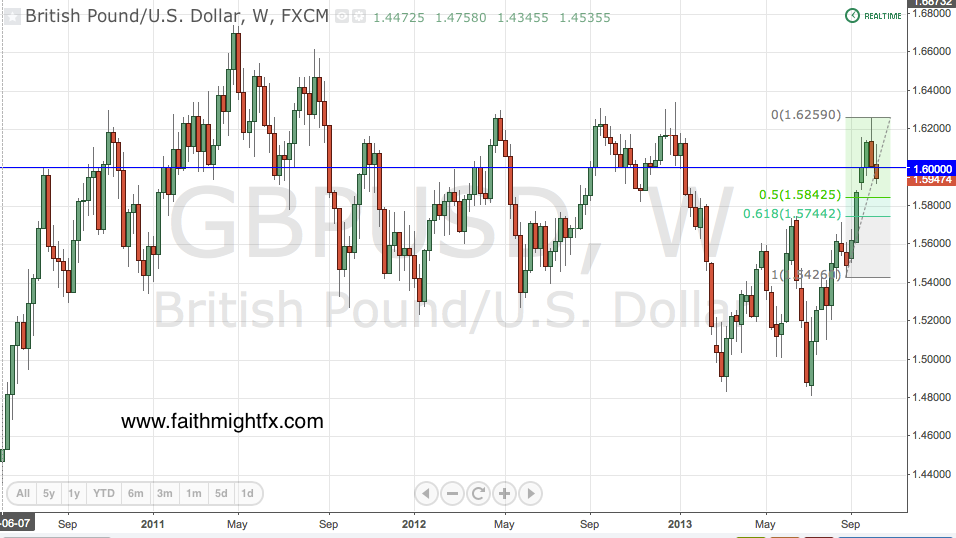
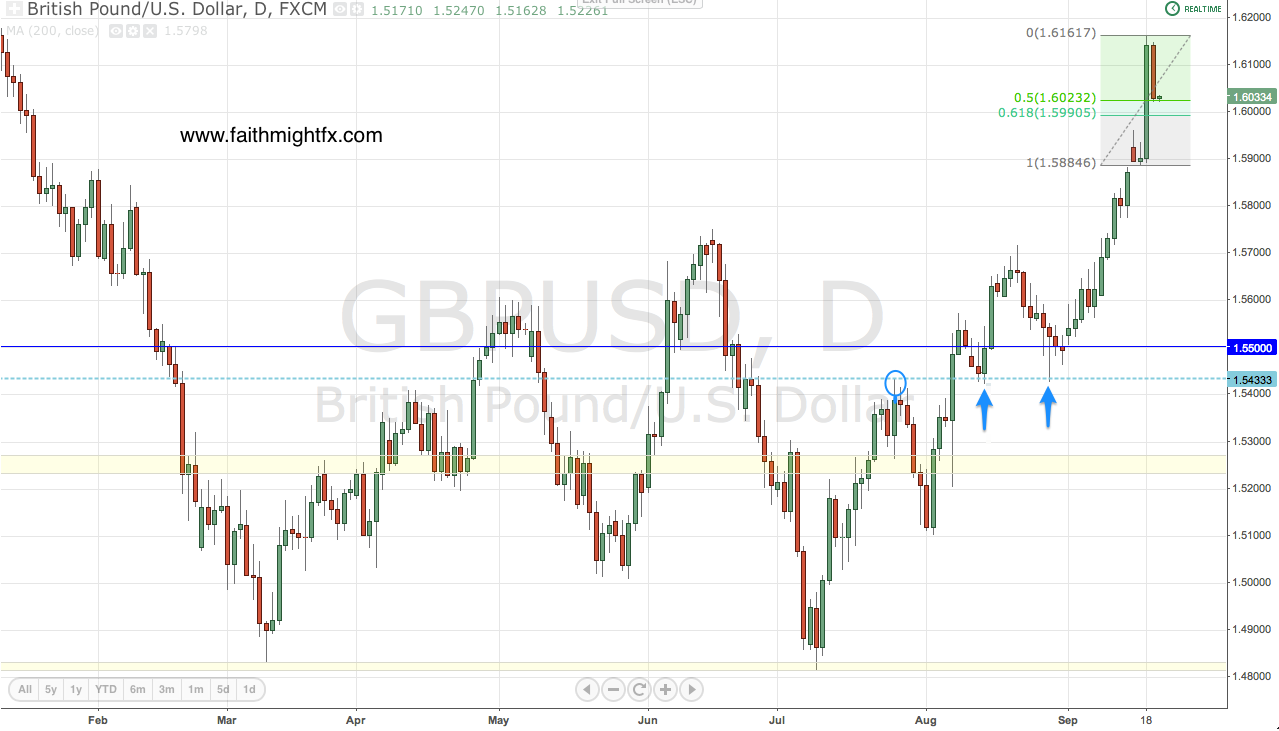
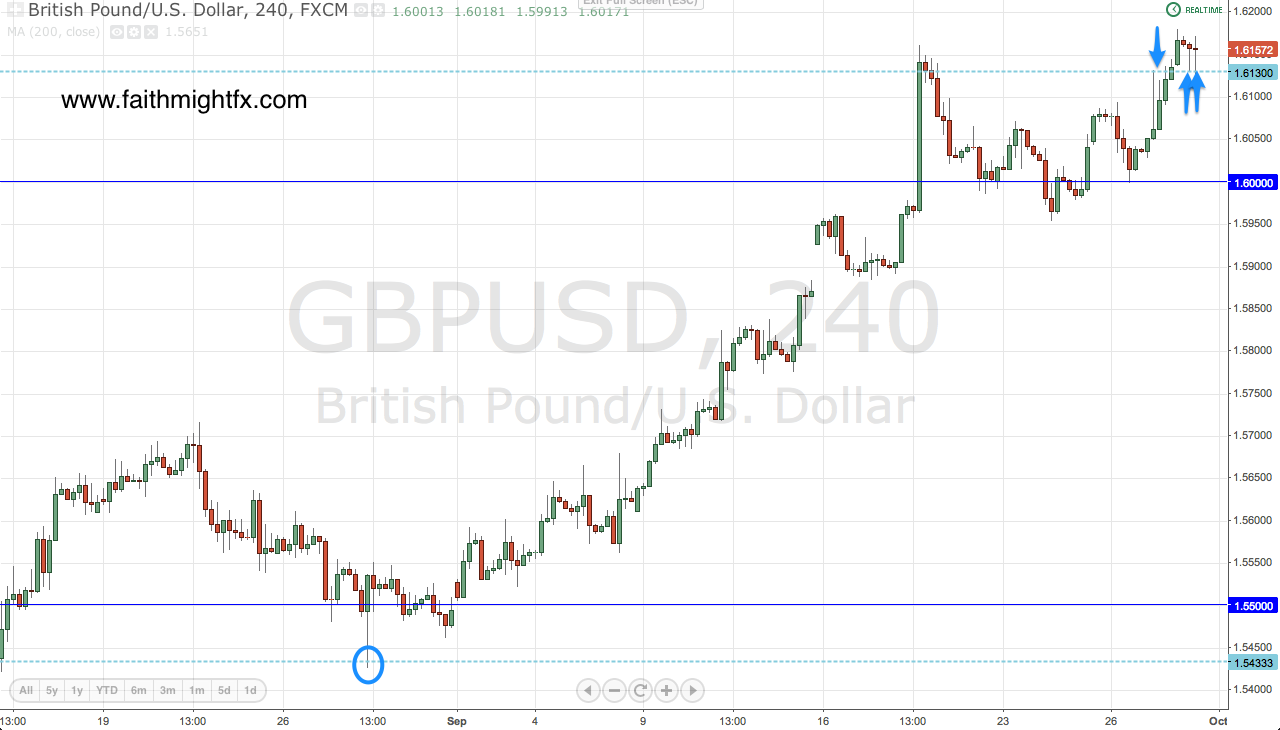
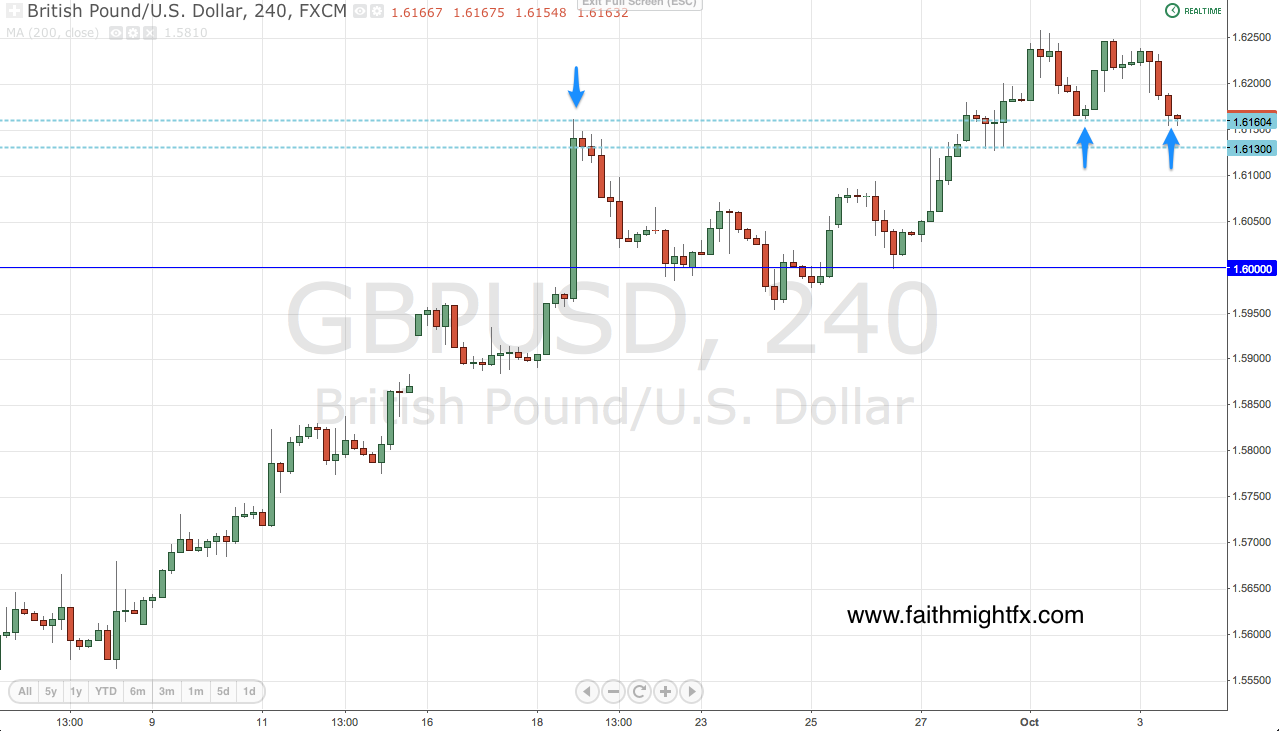
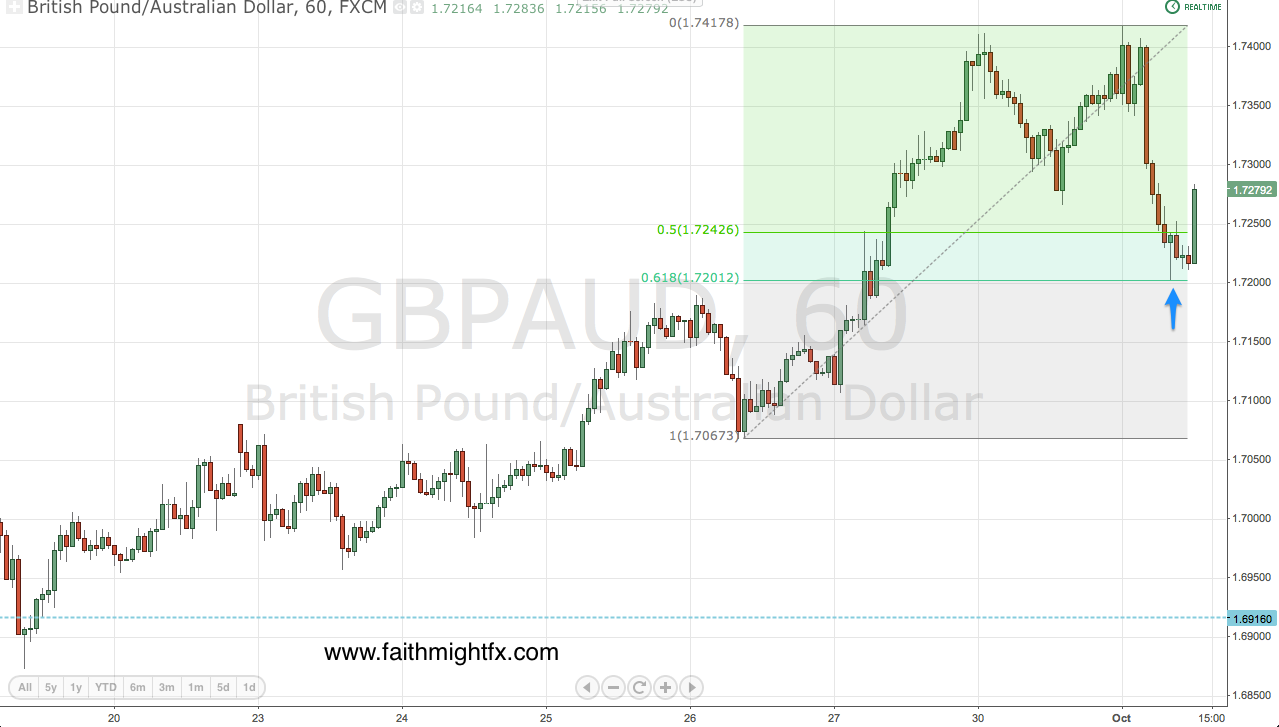
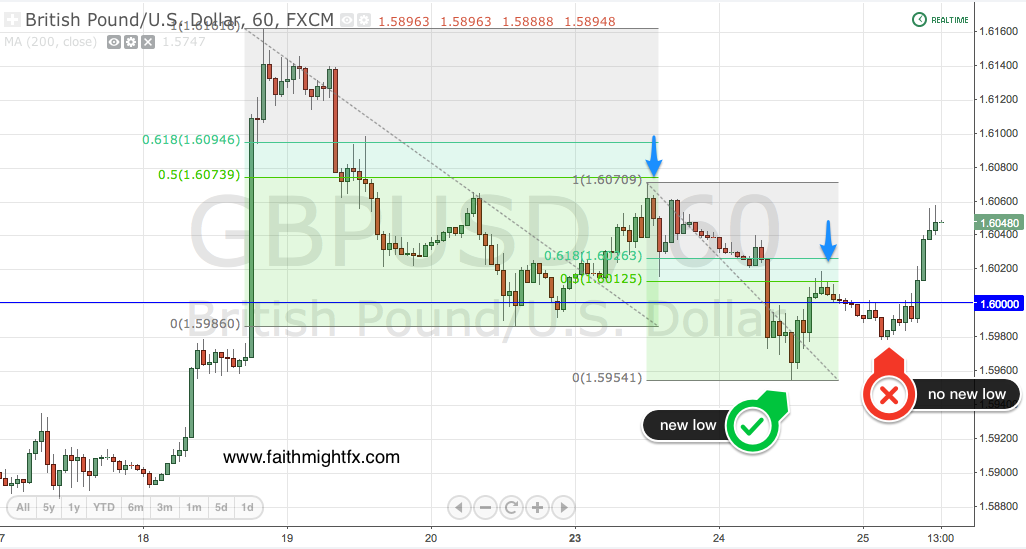
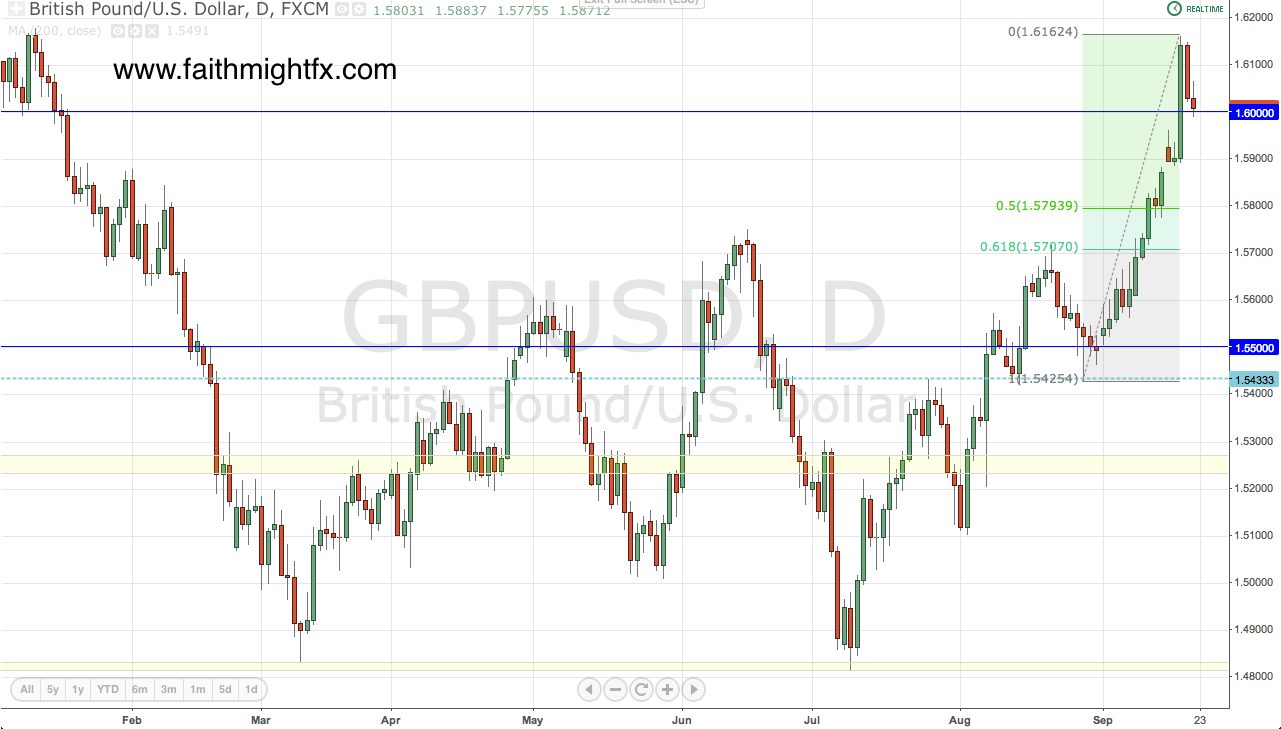
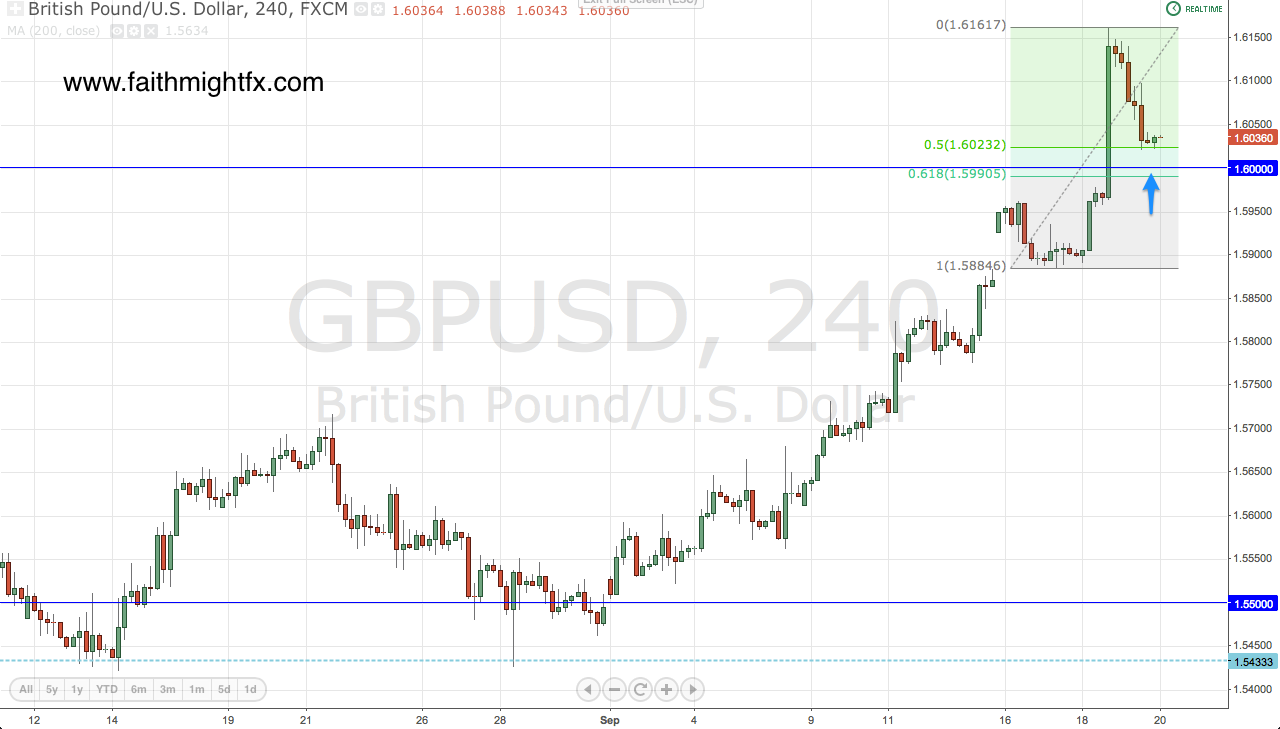
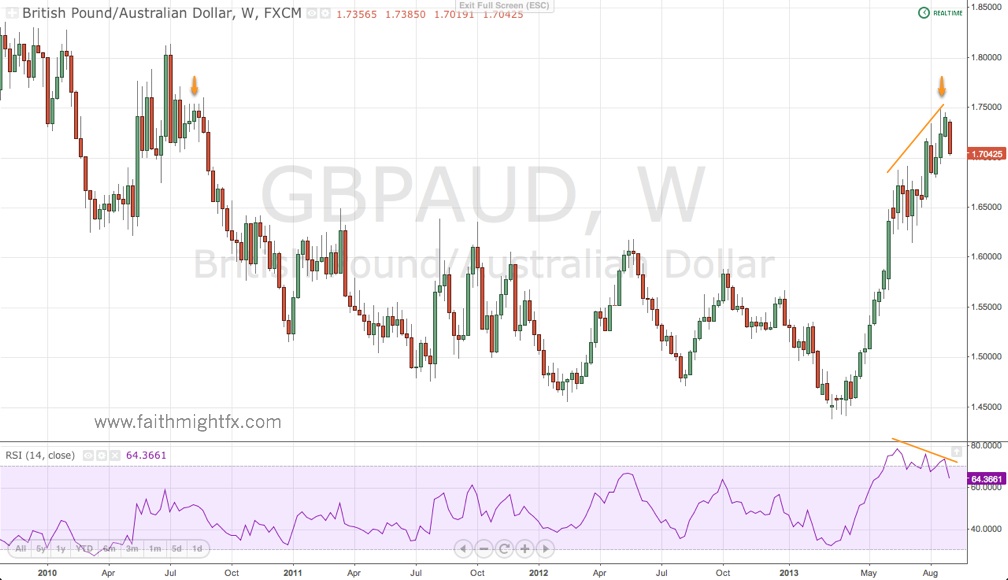
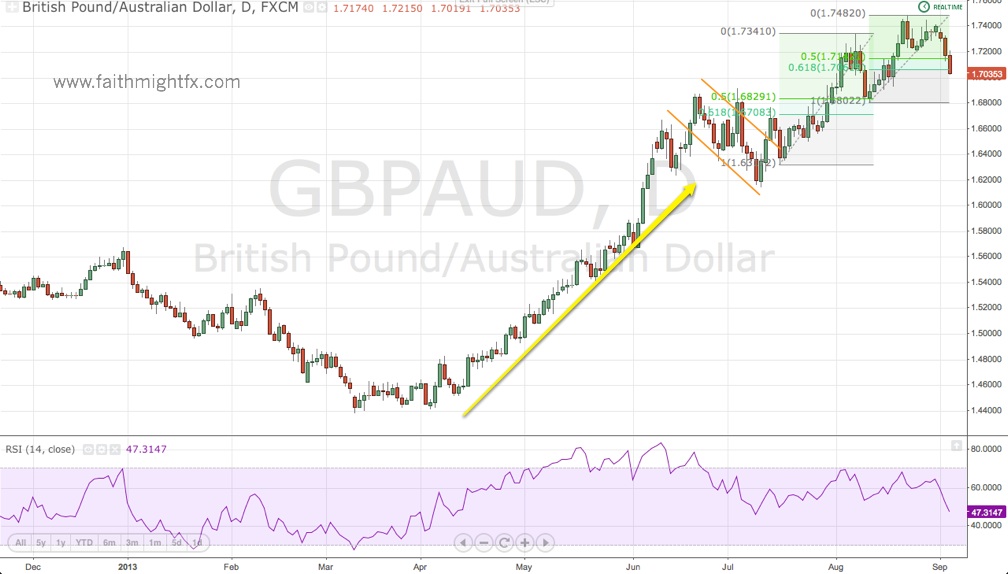
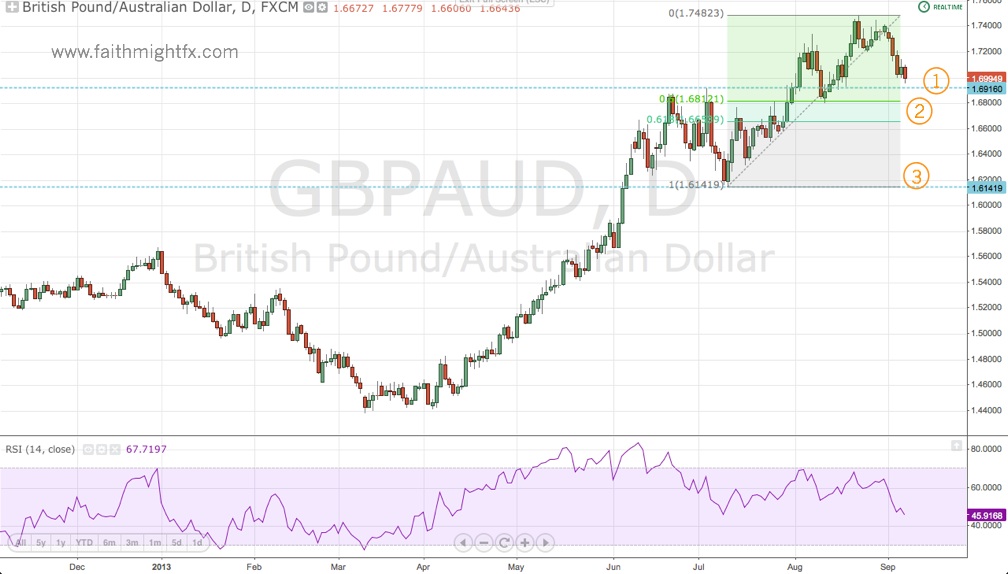
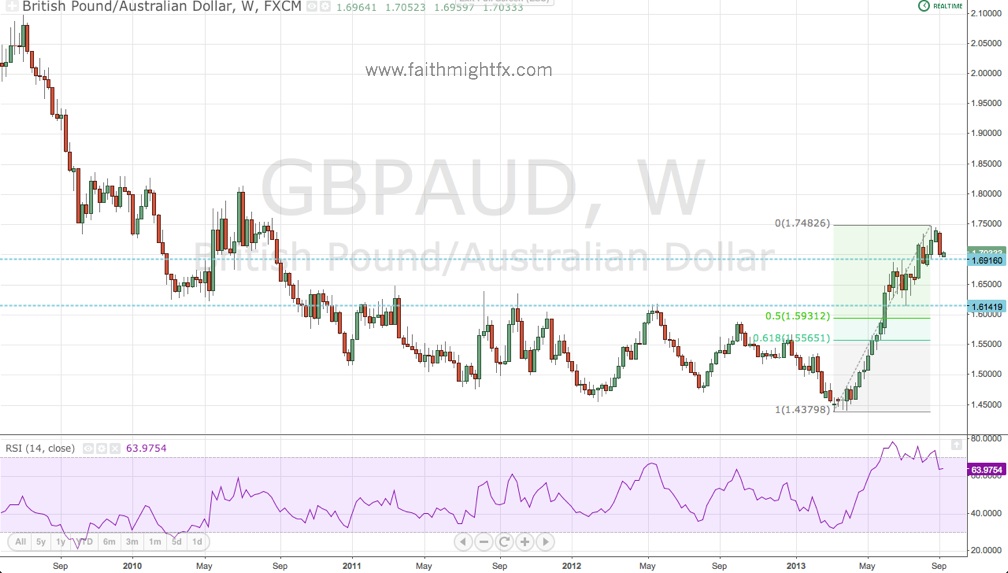
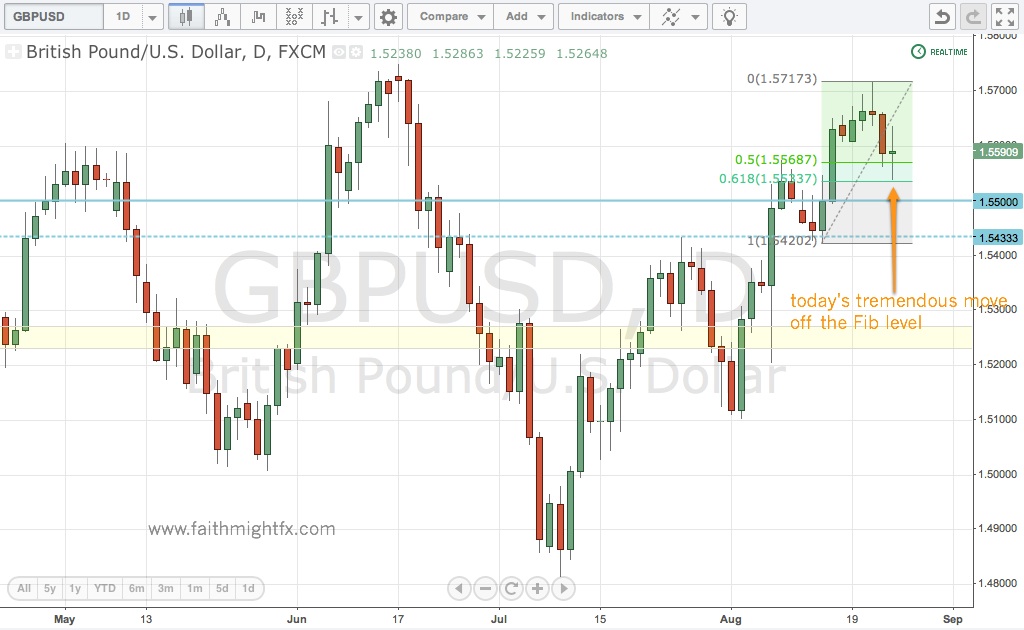
    So why the selloff this week? $EURGBP has rallied close to 150 pips off the lows. $GBPUSD and $GBPAUD have both tumbled handsomely from their highs. It looks like a classic case of buy the rumor, sell the fact. The market is forward thinking and now that fundamentals support price action, bulls are taking profits.

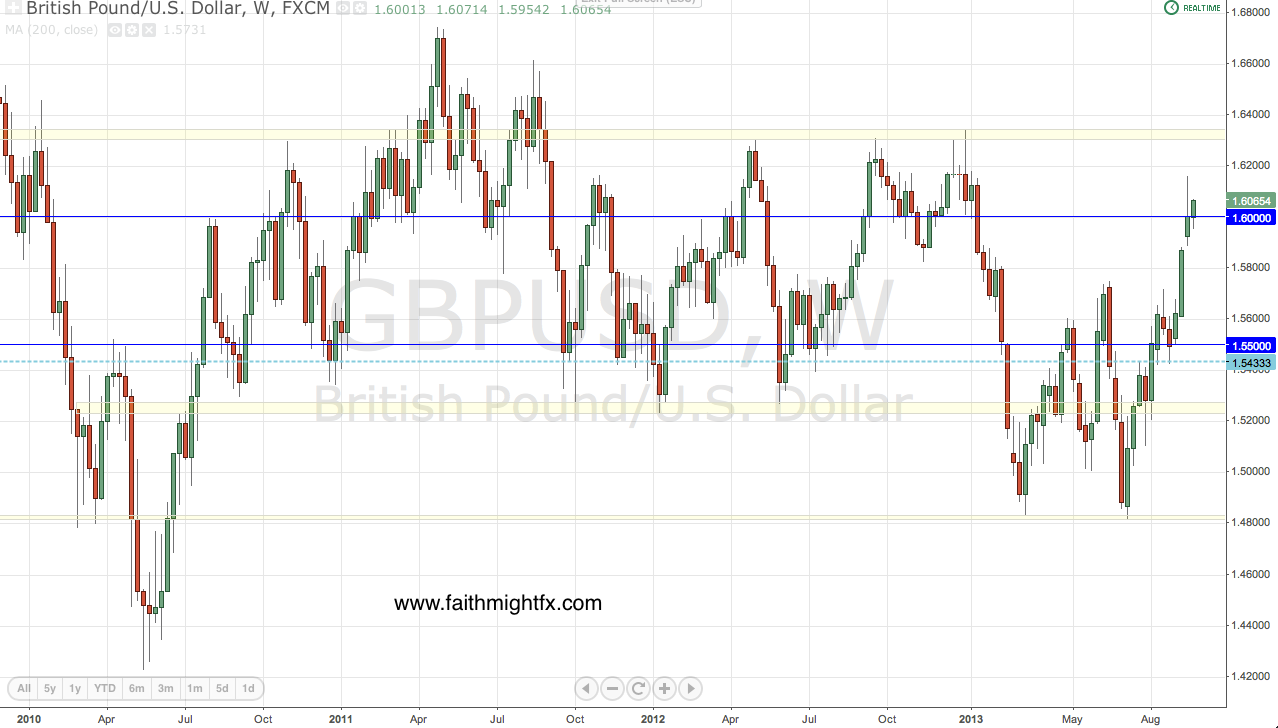
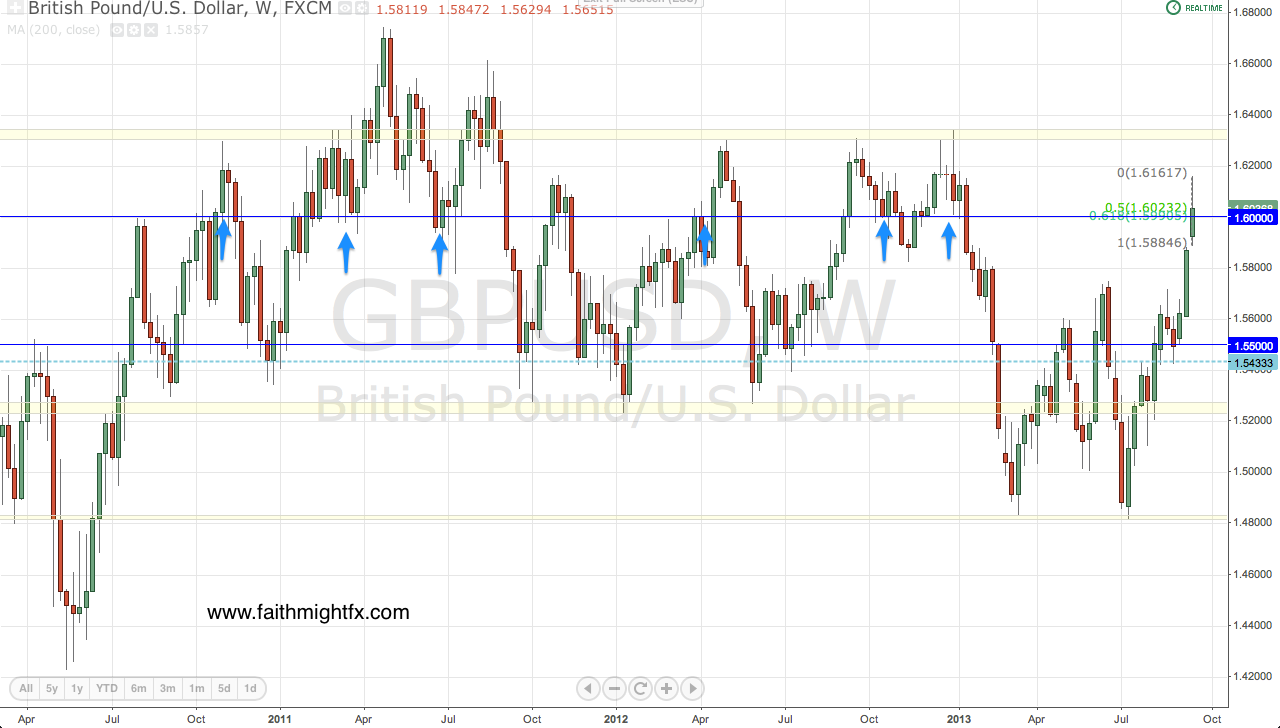
    Sterling is still very much bullish even at current levels in $GBPAUD, $GBPUSD and $EURGBP. However, these corrections have broken key support/resistance levels opening the door for a deeper correction into next week to match these tremendous GBP rallies.

    Mentioned above:

    UK economy growing at fastest rate in the developed world (Telegraph)

    Global PMI Data (Avondale Asset Management)

    Read also:

    GBP/USD In Yet Another Correction (FMFX)

    Australian Dollar Puts In a Bottom (FMFX)

    Reality Bites (FMFX)

    Respect the Zone (FMFX)


  • GBP/USD In Yet Another Correction

    $GBPUSD bulls just won’t give up. Every single time we have honored a previous high as support, we have seen cable take off to new mid-term highs.

    Here is Exhibit A, the daily chart from September 19th:

    GBPUSD daily chart

     Here is Exhibit B, the 4hr chart a week later on September 26th:

    gbpusd_4hr_9_30_13_5_56_AM

    Now here is today’s 4hr chart:

    GBPUSD 4HR CHART

    Bulls and bears are fighting it out, yet again, at a former high. Every battle won by the bulls have led to breakout rallies. A battle won by bears could see price fall to the level of support at 1.6130 which is also another former high (See Exhibit B). Below there is 1.6106, the 50% Fibonacci retracement level of this latest bullish wave. I don’t believe bulls will be truly done until 1.63 is challenged. These former highs are excellent areas for bulls to reload and gun for the ultimate prize above 1.6300.

    Trade what you see.

  • GBP/AUD Still Looking for Highs

    During the Tuesday Asian session and into the European session, the $GBPAUD fell to new lows at 1.72. This weakness is attributed to, first, the RBA staying pat on monetary policy when just last week the market was dealing with rumors of an interest rate cut from the RBA. A no-change announcement sparked a relief rally in the AUD, sending the $GBPAUD lower.

    Into the European session, the downside only accelerated as UK manufacturing missed market expectations. This helped price reach the 61.8% Fibonacci level at 1.72. However, this price was met by bids and buyers took the weakness as the opportunity to pile into the long term bullish trend that is still very much intact despite the price weakness.

    GBPAUD 1HR CHART

    Now with price up over 80 pips already from those 1.72 lows, it looks too late to get into this long trade. Never chase a trade but learn, instead, from the missed opportunity. The moral of the story: when price starts to fall off its highs, draw the Fibonacci levels and wait for price to react accordingly. The trader can then act accordingly.


  • GBP/USD Maintains Bullish Bias

    Since coming off the 1.6160 highs, I have believed that a deeper correction was underway. It wouldn’t come fast but it seemed to me that $GBPUSD could correct much of the breakout rally back to the 50% Fib level at 1.58.

    However, what has developed this week is a very different story. $GBPUSD has been very reluctant to move too far from the big psychological level at 1.60. Rallies this week met resistance at the Fib levels and dropped to new lows. A correction lower was in progress albeit on a very slow grind. However, today’s UK CBI retail sales release came in much strong than expected causing price to fail with a higher low after the corrective bounce.

    GBPUSD hrly chart

    The UK recovery story continues to have legs. And as long as that is the case, $GBPUSD remains on course to revisit the highs at 1.63.

    GBPUSD WEEKLY CHART

    Mentioned above:

    Nothing Moves In A Straight Line (FMFX)

    Today’s Appearance on FXStreet’s Live Analysis Room (FMFX)

    UK CBI distributive trades survey september: 34 vs +24 exp (Forex Live)


  • Today’s Appearance in FXStreet’s Live Analysis Room

    The FXStreet’s Live Analysis Room has become a fun place to stop by and chat markets with veteran trader Dale Pinkert. He has a brought on a wide-array of traders and market participants from all sides, aspects and backgrounds. It’s always an honor to be asked back. (Click the image to listen)

    onairnow_fxroom
    Listen to Tuesday’s interview ($GBPUSD AT 1.60)

    Mentioned during appearance:


  • Nothing Moves In A Straight Line

    This breakout rally from 1.55 has seemingly moved in a straight line up. There were very little corrections during this breakout. However, the correction that has started in the $GBPUSD last week has gathered steam today as cable falls below the major psychological level at 1.60.

    GBPUSD DAILY CHART

    The USD is gathering strength as US interest rates rise (most likely in anticipation of an eventual taper). However, the bullish bias in $GBPUSD doesn’t completely unravel until 1.57, the 61.8% Fibonacci level of this entire breakout rally. Before that level is the major 1.5750 level that capped rallies all year long before this recent breakout. With a light calendar week, it is very likely that $GBPUSD corrects back to the next major level at 1.5750. From there, it is decision time for bulls and bears.

    Mentioned above:

    Reversal in the Making (FMFX)

    GBPUSD Update (50’s Blog)

  • Reversal In The Making

    I have been saying all summer that if the $GBPUSD holds above 1.55, then we’d have the beginnings of a reversal in cable. Here we are now with $GBPUSD above 1.60 and a full-blown reversal before us.

     GBPUSD daily chart

    After 3 bullish waves (4 on this daily chart), $GBPUSD should be technically exhausted. So this correction back towards 1.60 is healthy and even expected.

    GBPUSD 4hr chart

    A hold above 1.60 has always been traditionally bullish for cable. Why should 2013 be any different? Despite the pullback off Wednesday’s highs, cable is poised quitely nicely  to make a run for the highs.

    GBPUSD weekly chart

  • Australian Dollar Puts In A Bottom

    The AUD was the darling currency of the last several years benefiting most from China’s rapid growth rates. The tables turned in 2013, however, as the darling of the forex market became a dog. The $GBPAUD rallied over 3,100 pips on AUD weakness just shy of 1.75 with a high of 1.7482. It had not traded at those levels since 2010.

    GBPAUD WEEKLY CHART

    The weekly RSI is very interesting here. There is a divergence here that has been developing for several months now making it a powerful indicator that, now after some time, $GBPAUD bulls are throwing in the towel.

    GBPAUD DAILY CHART

    The price movement in the orange channel back in July has been the only “bearish” move in $GBPAUD since April. Since, the pair moved well beyond the 1.6916 July high to make highs last week at 1.7482. The pullback last week turned into a legitimate bearish move with lows breaking the 61.8% Fibonacci level at 1.7061 and moving below the big psychological level at 1.70.

    The fundamentals certainly do support a bottom in AUD weakness. Last Tuesday, the RBA signaled an end to outright easing. Much of this breakout rally was due to RBA dovishness and interest rate cuts as other central banks remained unchanged in their monetary policies. Now that the RBA has shifted sentiment, the AUD may be due a significant relief rally.

    GBPAUD DAILY CHART

    With the break below 1.70, there are 3 support levels to watch in the coming sessions.

    1. 1.6916 is the former July high now turned support. We can see price has found support at this level twice before in August.
    2. The 50% and 61.8% Fibonacci levels at 1.6812 and 1.6653 respectively.
    3. The July low at 1.6141. A break below this level would mean a serious unraveling of this tremendous 2013 rally.

    This is the potential of this breakdown:

    GBPAUD WEEKLY CHART

    Needless to say, we have a long way to go but if the fundamentals continue to improve for the AUD, the 1.5930 level could very well be reached.

    Trade what you see.

    Mentioned above:


  • Is GBP/USD Still Bullish?

    Getting a lot of questions from traders this morning (PST) asking why the GBP is falling across the board when UK 2Q GDP came out higher-than-expected. There are several reasons.

    1. The market can do whatever it wants.

    The move could have been caused by profit-taking, swing buyers, or position-sizing. It doesn’t matter. Trade what you see, not what you think. The market doesn’t have to rally on good numbers and doesn’t have to fall on bad. Know your levels and trade what price is actually doing.

    Not all dips are acts of weakness.

    GBPUSD DAILY CHART