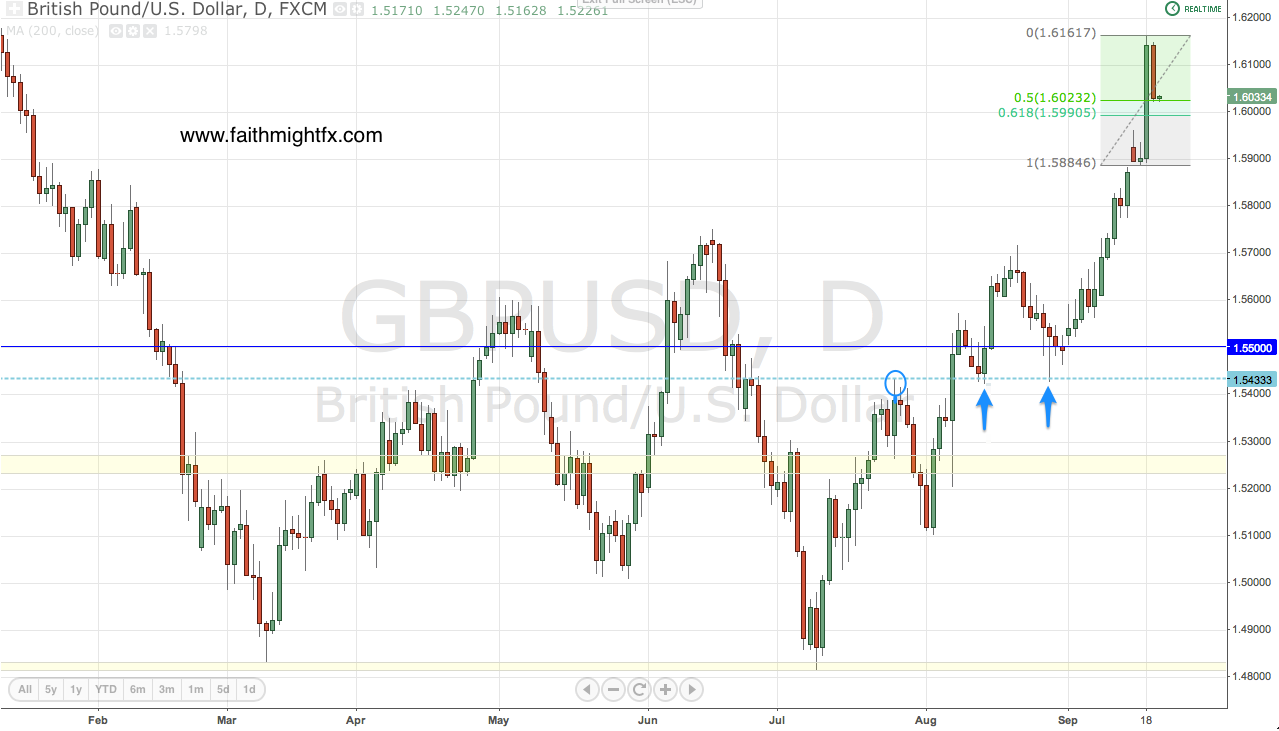
$GBPUSD bulls just won’t give up. Every single time we have honored a previous high as support, we have seen cable take off to new mid-term highs.
Here is Exhibit A, the daily chart from September 19th:
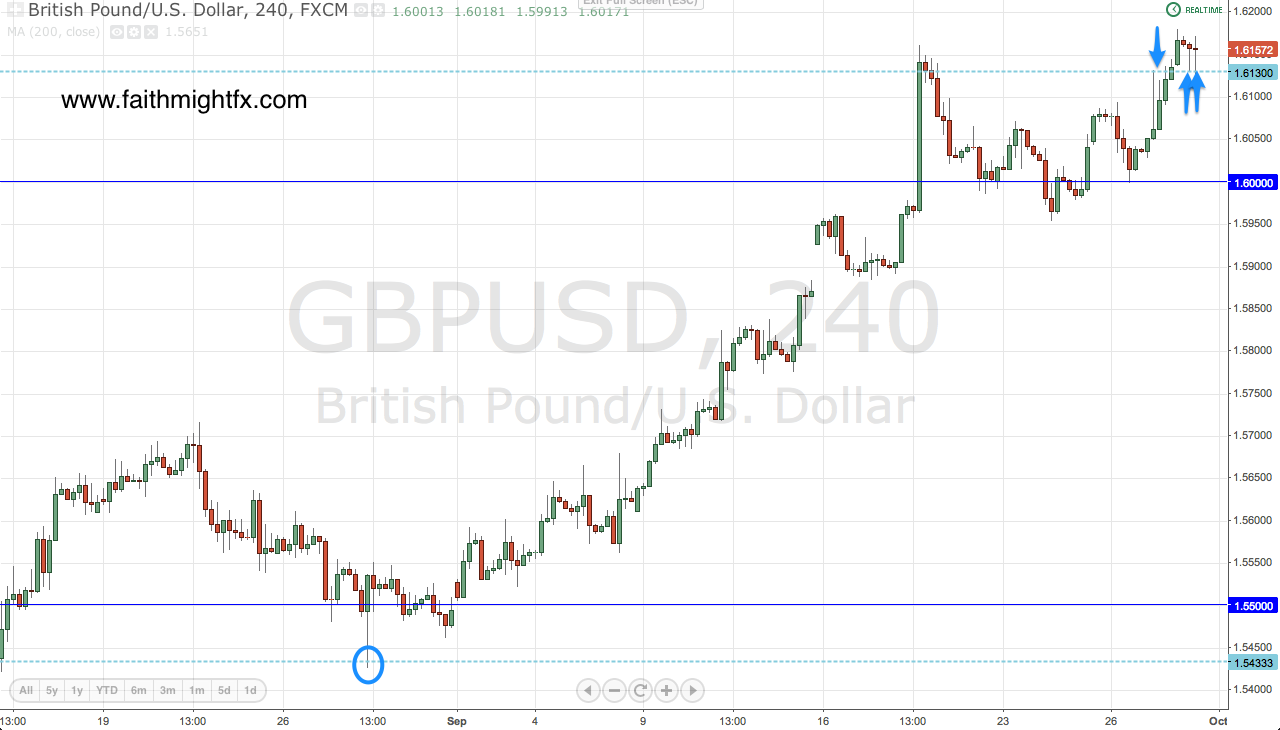
Here is Exhibit B, the 4hr chart a week later on September 26th:
Now here is today’s 4hr chart:
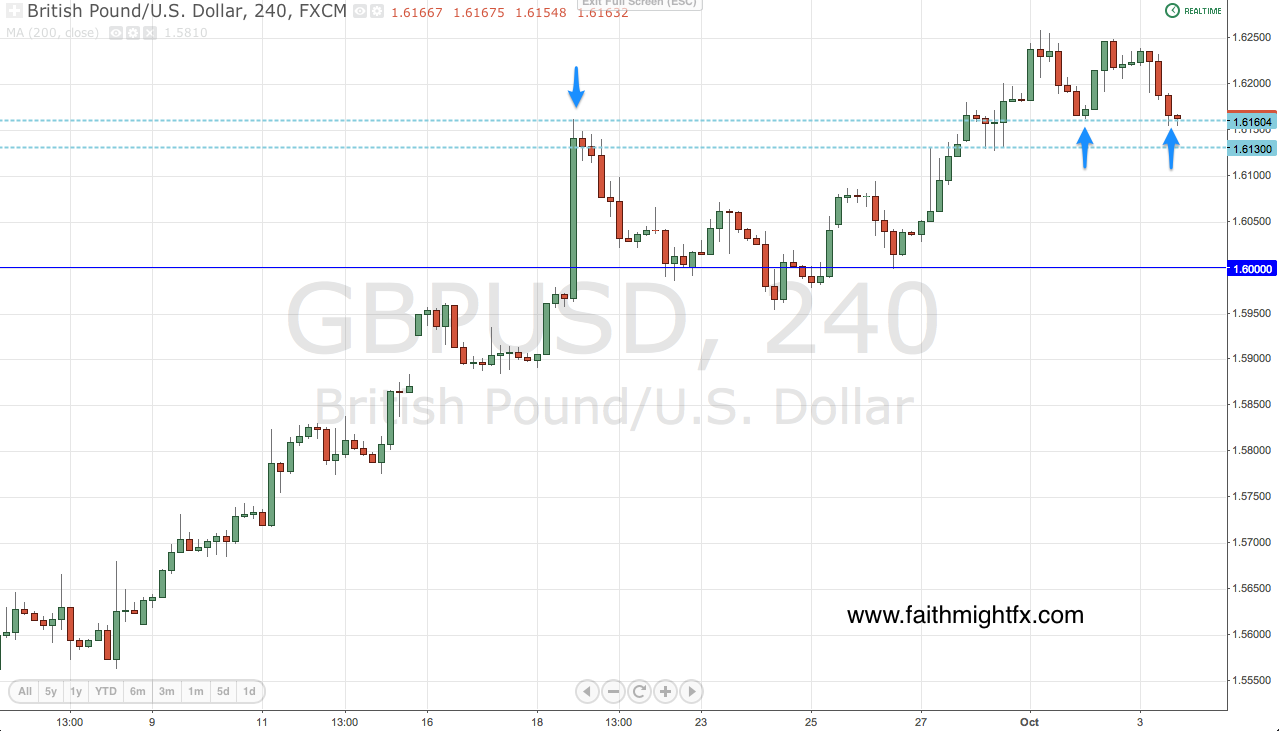
Bulls and bears are fighting it out, yet again, at a former high. Every battle won by the bulls have led to breakout rallies. A battle won by bears could see price fall to the level of support at 1.6130 which is also another former high (See Exhibit B). Below there is 1.6106, the 50% Fibonacci retracement level of this latest bullish wave. I don’t believe bulls will be truly done until 1.63 is challenged. These former highs are excellent areas for bulls to reload and gun for the ultimate prize above 1.6300.
Trade what you see.