In this episode of UNCHARTED Podcast, we discuss Cryptocurrencies, Commodities, Stocks, and the prevalence of the US Dollar on the Currencies Market.
On the Cryptocurrency front, we discuss Bitcoin, Ethereum and Solana, and what investors in this asset class could expect in the coming weeks and months. On Commodities, we discuss Gold, Brent Oil and WTI Oil. We also made some forecasts on both Oil and Gold. We then looked at S&P 500, Disney, and Coinbase on the Stocks front.
Watch and Enjoy.
Some of these ideas are in our clients’ portfolios. To understand if this one can work for you or for help to invest your own wealth, talk to our advisors at FM Capital Group. Would you like more information on how to get stock indices in your portfolio? Schedule a meeting with us here
The Dow opened in 2022 at $36,313 and the year kicked off into a rally. For the first two trading days, the Dow continued to rally and on the third day it shot all the way up to $36,943, which now stands as its all-time high. Since the all-time high, price has dipped and every month in this year except for March and May have closed bearish.
Weekly Chart
A little backstory on the Dow. During the lockdown, specifically in March 2020, Dow Jones hit $18,300, a dramatic fall from the then all-time high at $29,550. Following the ease of lockdown, the Dow bulls got back in action and the price began a rally from April 2020 up to January 2022 – a 21-month bull run.
Monthly Chart
Last month, i.e. June 2022, price went as low as $29,642 and the month eventually closed at $30,767. The last time price was at $29,642 was in December 2020. In the next few weeks, we might be seeing price rally to $31,000 from its current price at $30,772.
Some of these ideas are in our clients’ portfolios. To understand if this one can work for you or for help to invest your own wealth, talk to our advisors at FM Capital Group. Would you like more information on how to get stock indices in your portfolio? Schedule a meeting with us here
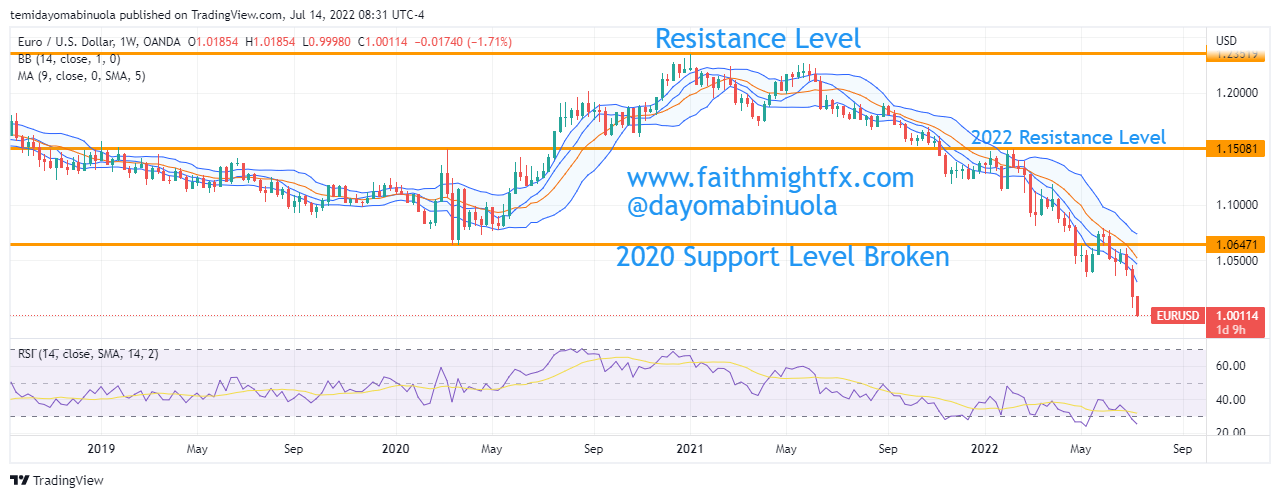
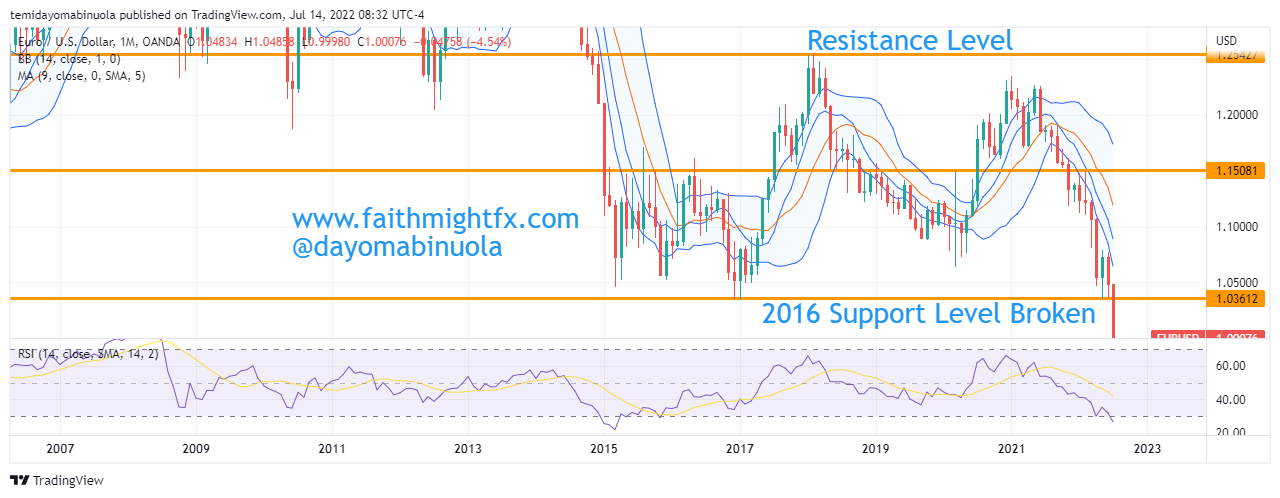
The appreciation of the dollar against other currencies continues as a two decades record has been broken. From the time EURUSD has been listed on trading-view in May 1993, the lowest price of EURUSD stands at 0.82623. in November 2000. That is to say, the US dollar gained more than the EUR since its listing on trading-view. For another 8 years, the EURUSD appreciated to an all-time high at 1.6000 specifically in April 2008.
Weekly Chart
Since the appreciation of the EURUSD to the all-time high at 1.60000, on the monthly chart, there have been lower highs and lower lows. This movement signifies a downtrend. For the first time in 20 years, the EURSD reached a par as 1 EUR equals 1 Dollar on the 12th July, 2022. in the next few months, Euro might bounce from the current support at 0.99960 to a new resistance at 1.07657. Currently, the dollar looks strong.
Monthly Chart
Some of these ideas are in our clients’ portfolios. To understand if this one can work for you or for help to invest your own wealth, talk to our advisors at FM Capital Group. Would you like more information on how to get currencies in your portfolio? Schedule a meeting with us here
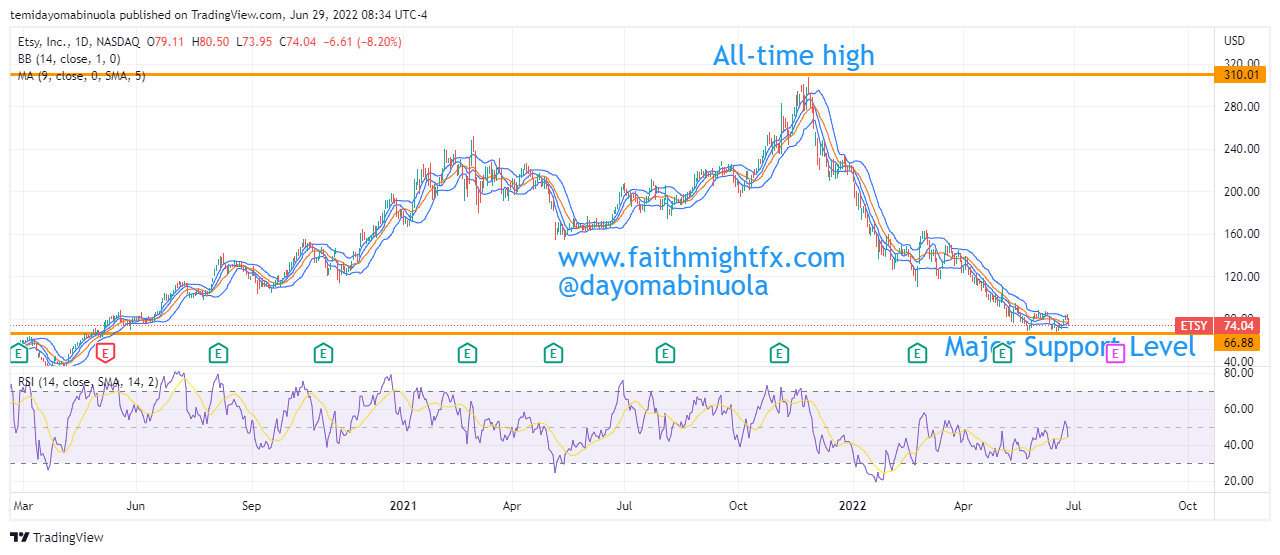
Since the all-time high of Etsy was reached in November 2021 at $309.06, price has continued to dwindle as it has lost over 75% of its all-time high. The price of Etsy at the beginning of 2022 was at $222. Etsy has not recorded any profits this year as price has kept falling from the opening price of the year.
Daily Chart
Etsy’s share price is currently at $74.04 and the current support level sits at $66.98. Earlier in the year, precisely between February and April, there was a range in price between $113 and $164. The price broke out late in April which led the price to reach its current support level in mid-June 2022. This support level was last reached in May 2020.
Weekly Chart
On the daily, weekly, and monthly charts, there are no indicators of price being oversold on the RSI. Could this be an indication of a possible continued downward run of Etsy’s share price keeping in mind that on the 28th of June, 2022, the price opened at $79.11 and closed at $74.04 which was an 8% loss in just a single day? On another hand, candlesticks on the daily time frame indicate that price has been consolidating. From our analysis, we see the bears continuing to push the price lower despite the consolidation.
Some of these ideas are in our clients’ portfolios. To understand if this one can work for you or for help to invest your own wealth, talk to our advisors at FM Capital Group. Would you like more information on how to get stocks in your portfolio? Schedule a meeting with us here
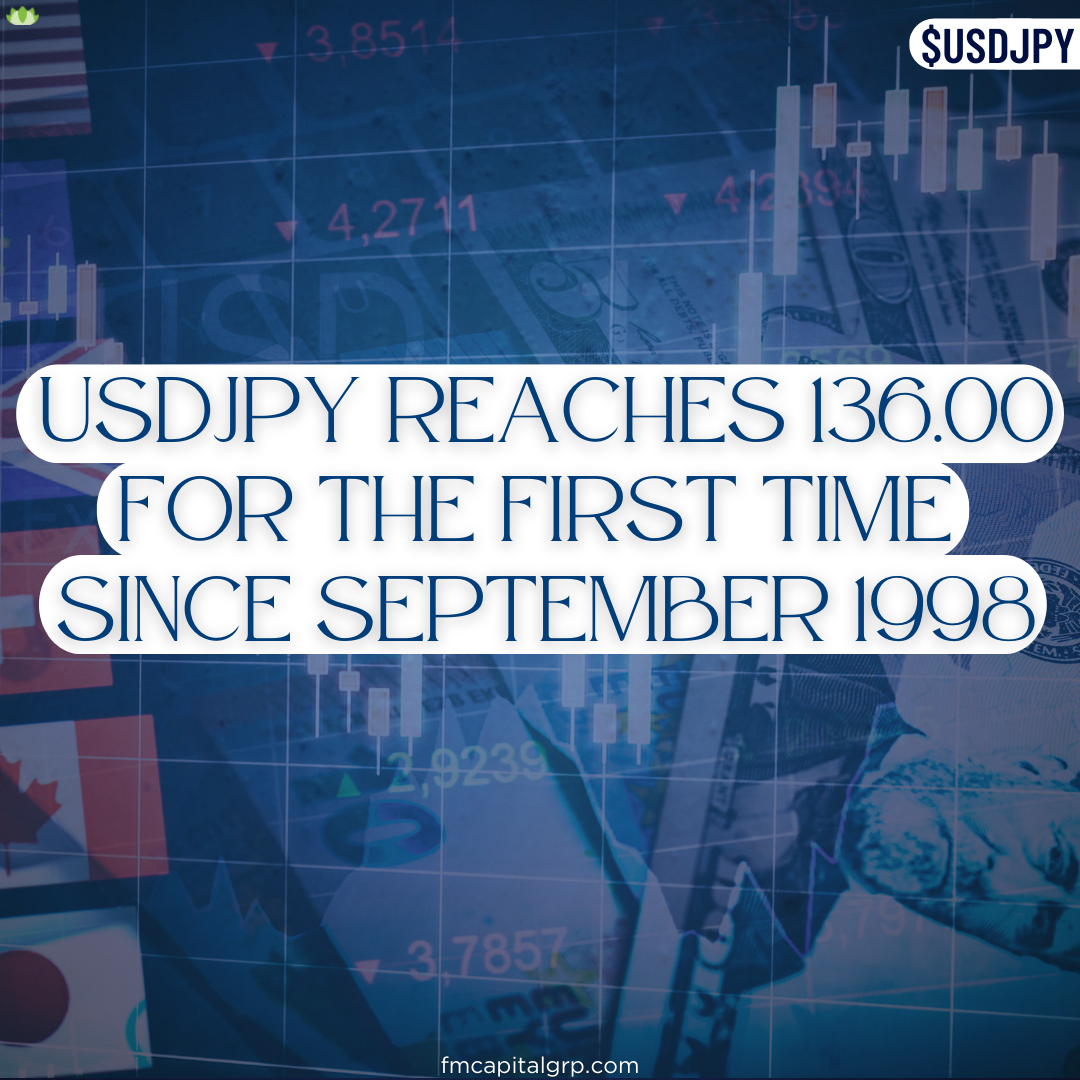
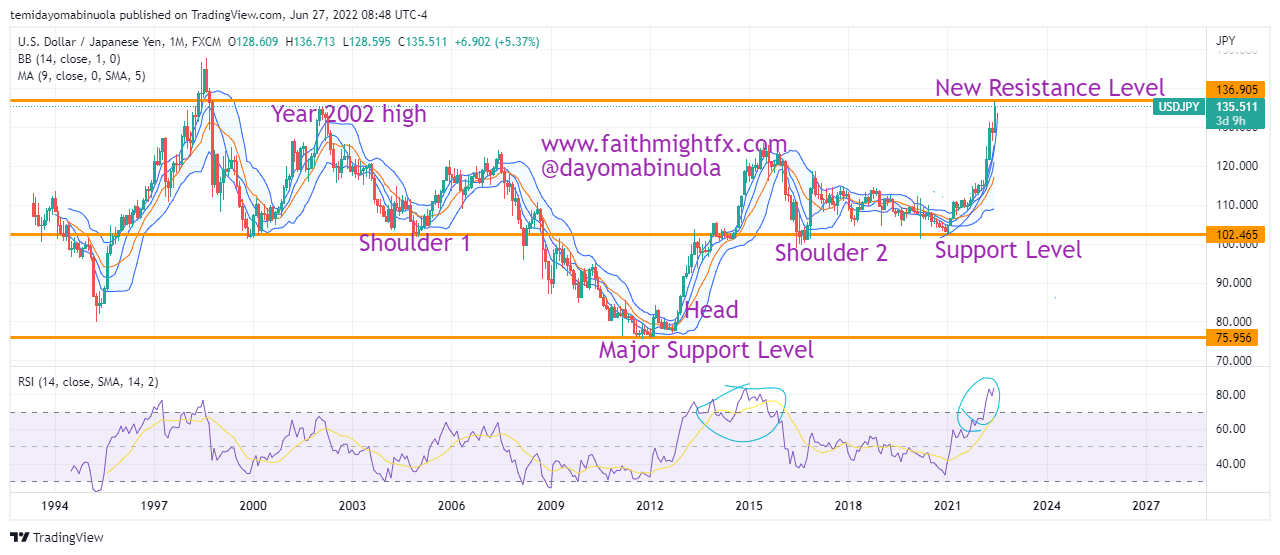
On the USDJPY monthly chart, it took it 12 years for a head-and-shoulder pattern to be formed. The first shoulder was formed in 2004, followed by the head in 2011, and the second shoulder was formed in 2016. After the second shoulder was formed, price ranged for 6 years before a major rally started. Despite the lockdown across the world in 2020, the YEN only gained the USD with few pips.
Monthly Chart
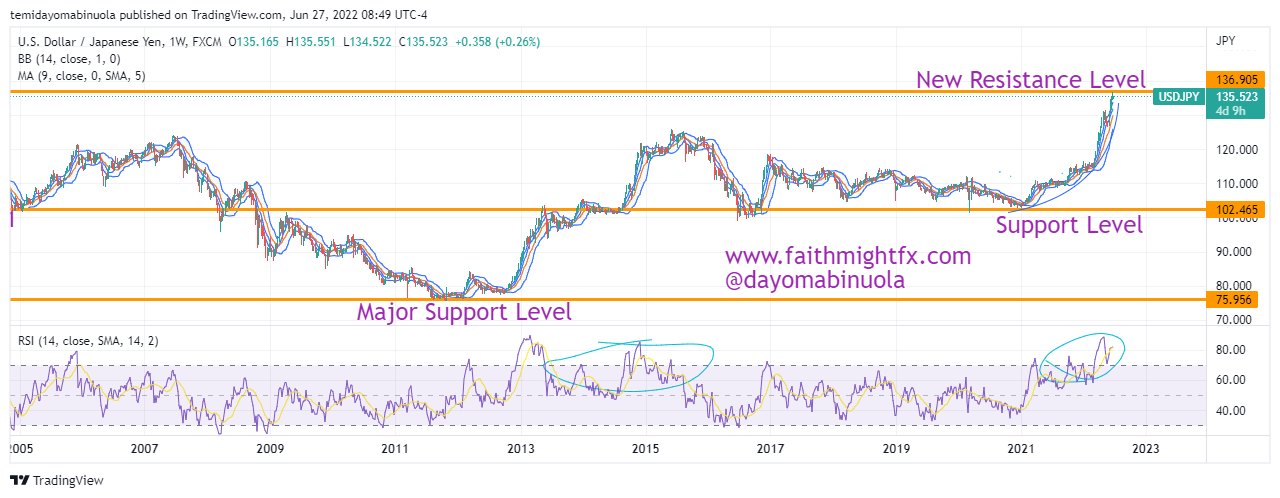
For the past 12 years, the USD has shown to be a stronger currency. The lowest price of $USDJPY was $5.956 in February 2012. The current price is at 135.508. The highest value of USDJPY since 2002 has been 135.126. Price was able to surpass the 2022 high few days ago after price reached $136.822, the highest price since September 1998. A consolidation in price might occur has the USD dollar has been massively gaining against the Japanese yen since the beginning of 2021.
Weekly Chart
This expected price consolidation might make price fall, which could in favour of the YEN in the next few weeks. The price could be at 130.00
Some of these ideas are in our clients’ portfolios. To understand if this one can work for you or for help to invest your own wealth, talk to our advisors at FM Capital Group. Would you like more information on how to get currencies in your portfolio? Schedule a meeting with us here
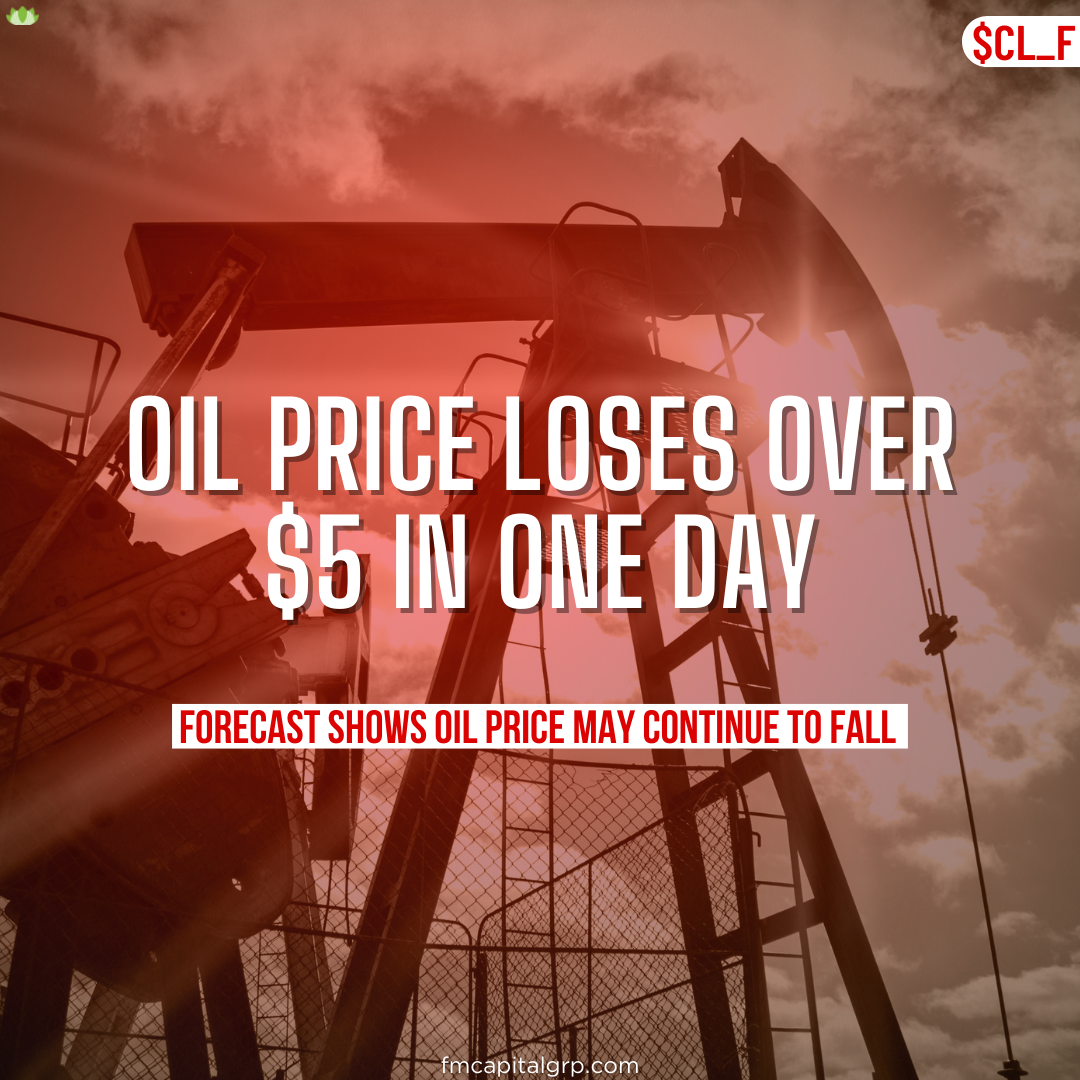
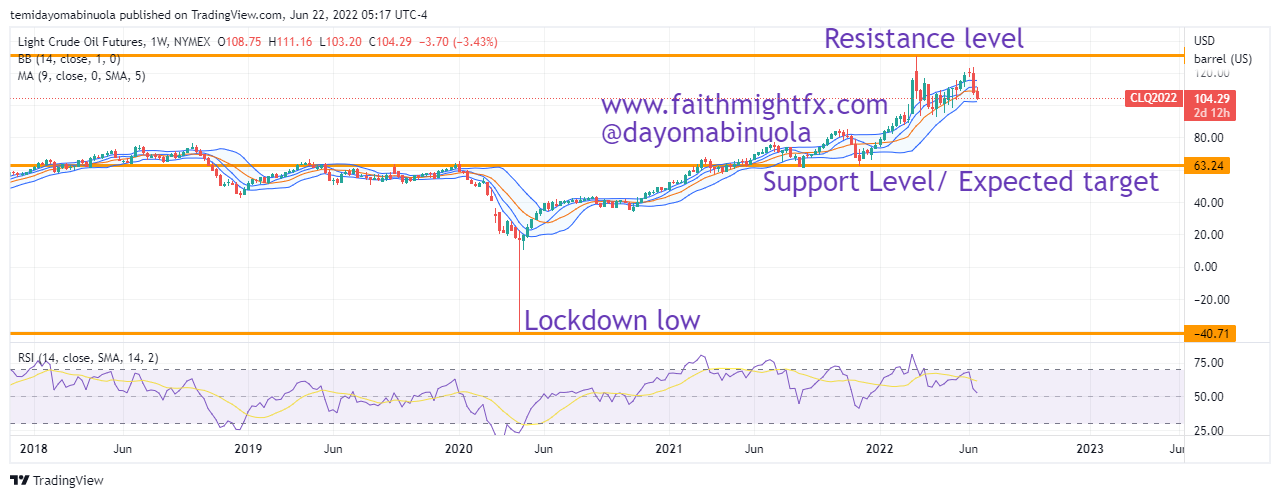
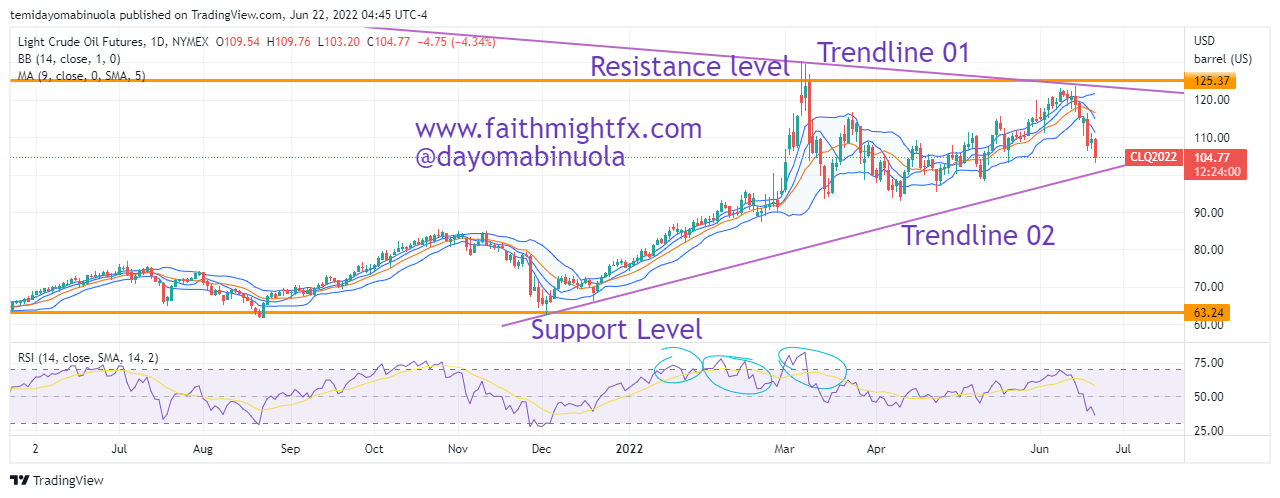
In March 2022, price of WTI rose to $130.37 per barrel, making it the highest price of crude oil in 14 years. Ever since then, the year’s resistance was maintained at that level. The all-time high of crude oil price was reached at $147.40 per barrel in June 2008. During the global lockdown in April 2020, there was an historical price fall. The price of crude oil went as low as negative price, as WTI was at -$40. The price closed on the 20th of April 2020 at -$37.51, as there was little or no demand for crude oil globally. The next day after this historical fall, price was back to double-digits.
Weekly Chart
The most part of Q2 2022, shows price has been over $100 most of the time. Some analysts have concluded that world might see a recession soon. Commodity prices globally might fall if the recession becomes a reality. As investors have concerns about the likelihood of a recession, and the Biden administration is prepared to step up its fight against lofty pump prices by calling a tax holiday on gasoline. The WTI fell to 104.40 from $109.74. As it stands, the oil price is headed to the first monthly loss since November 2021. If this fall persists, the oil price might fall to $62.63 per barrel which was the December 2021 support level. On the daily chart, between January and February 2021, RSI showed at three different occasions where price of crude oil has been overbought.
Daily Chart
Some of these ideas are in our clients’ portfolios. To understand if this one can work for you or for help to invest your own wealth, talk to our advisors at FM Capital Group. Would you like more information on how to get commodities in your portfolio? Schedule a meeting with us here
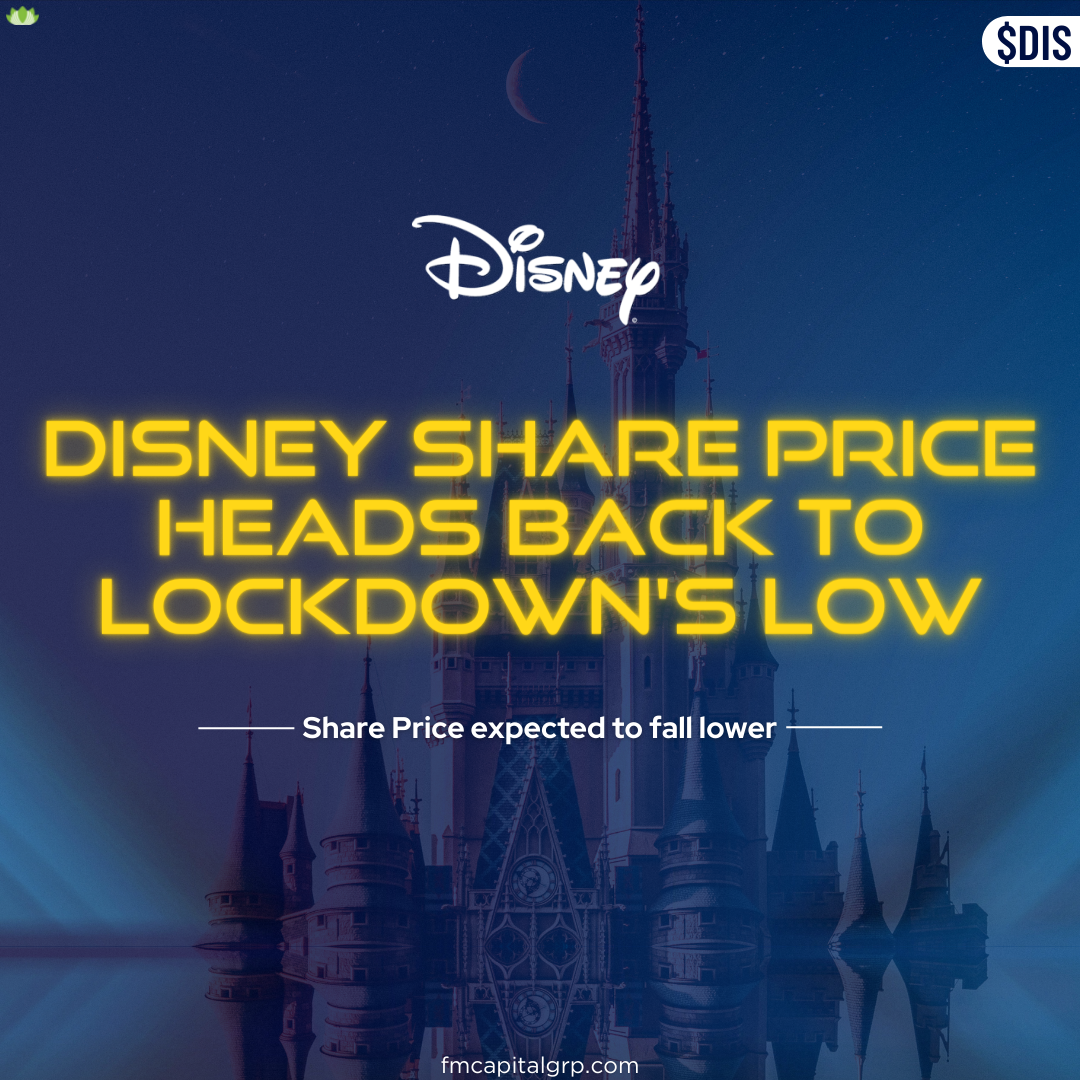
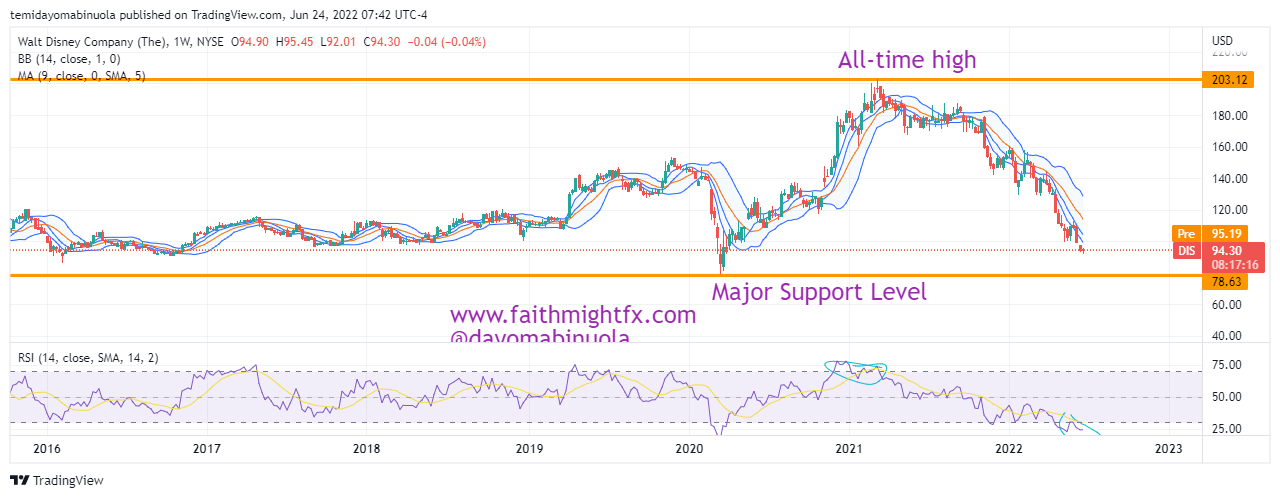
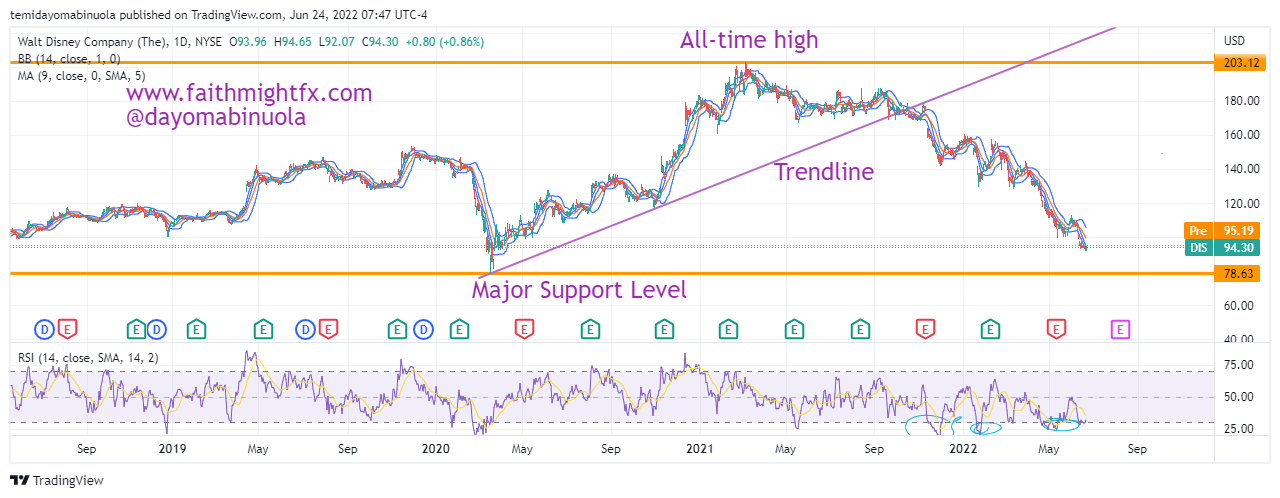
Like many other stocks, Disney share price fell to $78.63 in March 2020 as a result of the global lockdown. Prior to the fall in 2020, Disney’s all-time high was at $154.84. The ease of lockdown led to the rally that pushed the price of Disney all the way up to $203.12 in March 2021. This price currently stands as the all-time high.
Weekly chart
After the all-time high, the share price was caught in a range on the weekly chart. The range began at the end of March 2021 and stretched to the first week of November 2021. The share price broke out of the range to the downside in the second week of November 2021. The breakout has led to a continuous downward slope in price as price as of June 23, 2022 is at $94.30, which is over a 50% loss from the all-time high.
Daily Chart
We can say Disney’s share price is currently in the region it was during the lockdown. Recent reports claim Disney’s share price dip is partly due to their insistence in inserting Queer ideology into its children movies which people see as “child-grooming” and therefore, reprehensible. Indications on RSI shows that price is currently oversold on the weekly time frame. Our analysts see Disney’s share price fall below the Lockdown low of $78.63.
Some of these ideas are in our clients’ portfolios. To understand if this one can work for you or for help to invest your own wealth, talk to our advisors at FM Capital Group. Would you like more information on how to get stocks in your portfolio? Schedule a meeting with us here
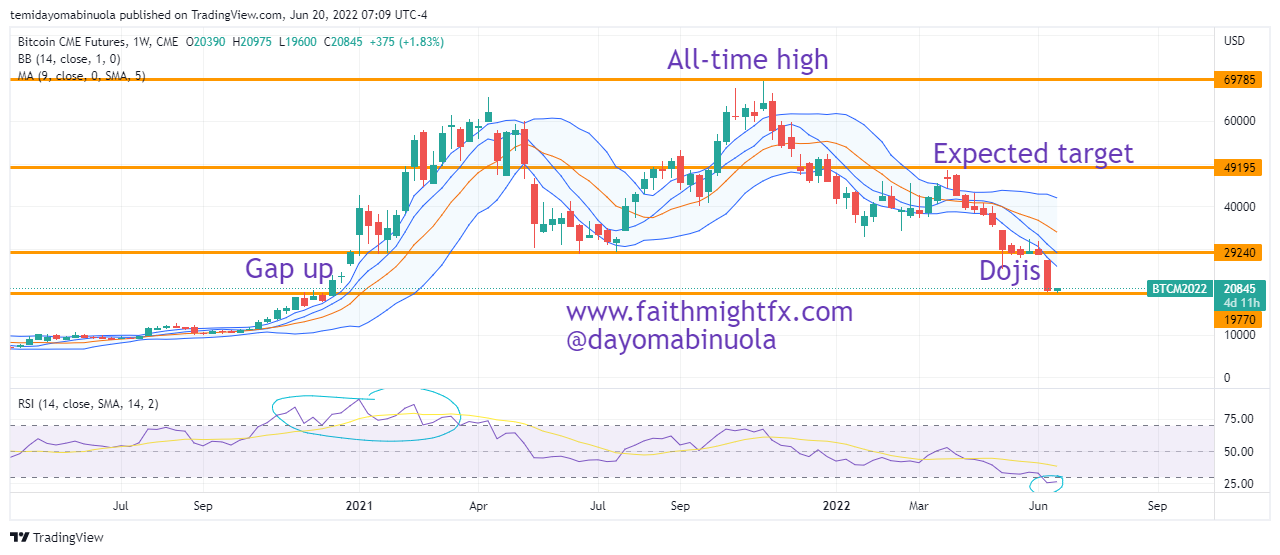
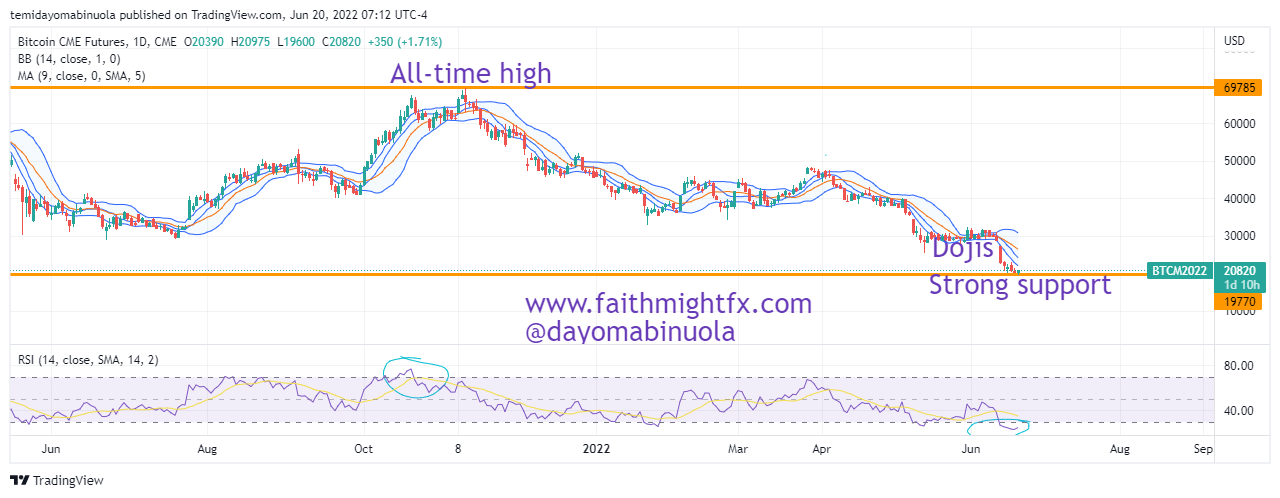
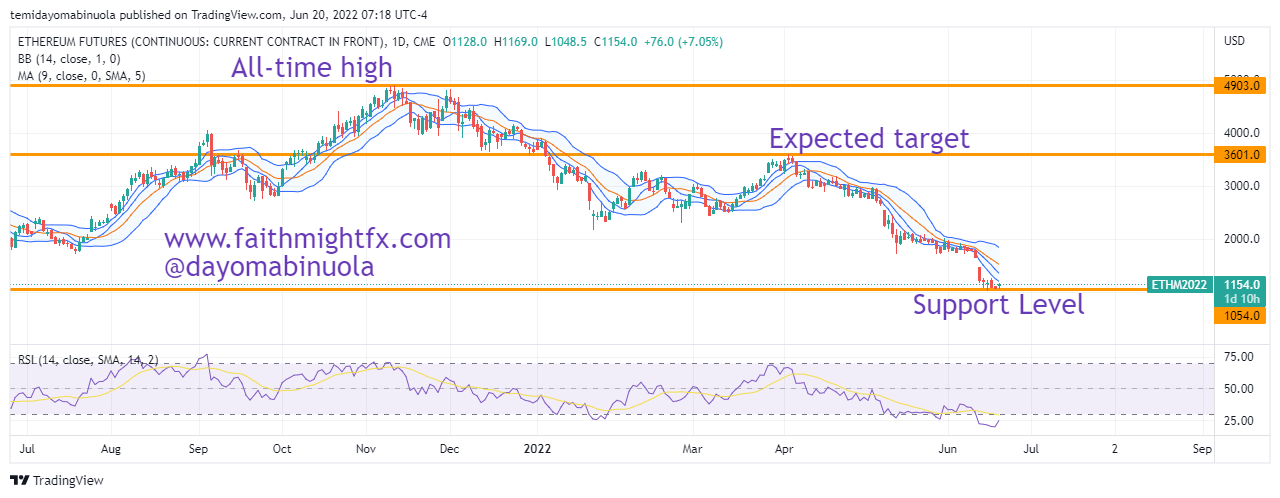
In one of our articles written in Q4 2021 when the price of Bitcoin was at $58,229 and Ethereum at $4,200, we talked about price of Bitcoin to fall to $29,000. On the 10th of May, 2022, Bitcoin reached $29000, which was spot on. Many of the bulls have been liquidated due to the recent price fall. With the price fall of Bitcoin to $20,000, the gap up in December 2020 and January 2021 has been filled.
Weekly Bitcoin Chart
Our forecast currently shows crypto bulls are about to resume activities, as we might be seeing a rally in the coming weeks. Price of Bitcoin might be back to $48,000 and Ethereum to $3,500. This could be a sign of relief for investors after crypto has lost $1.1trillion in market capitalization in the last 80 days, the fastest and largest known loss in its history. Buying Bitcoin $48,000 and buying Ethereum above $3500 might be a bull trap. We might be seeing Bitcoin at a 4-digit value and Ethereum at a 2-digit value after prices reach $48,000. Are investors prepared to see price of Bitcoin at $4,000 and Ethereum at $90? Time will tell.
Bitcoin Daily chart
Yes, the market is about to favour the bulls, as a strong support is reached at $20,000 for bitcoin and Ethereum at $1,000. RSI on the weekly chart shows price has been oversold. There are some dojis formed in May and the first week in June, which is a sign of price reversal. Currently we still have price in the lower region of the Bollinger bands, as price is consolidating.
Ethereum Daily Chart
Some of these ideas are in our clients’ portfolios. To understand if this one can work for you or for help to invest your own wealth, talk to our advisors at FM Capital Group. Would you like more information on how to get cryptocurrencies in your portfolio? Schedule a meeting with us here
The cryptocurrency space has suffered a setback in recent times as most crypto assets have dipped in price. This has led to the funds of many investors and traders being wiped out. The hope of price recovery keeps dashing out as price continue to fall.
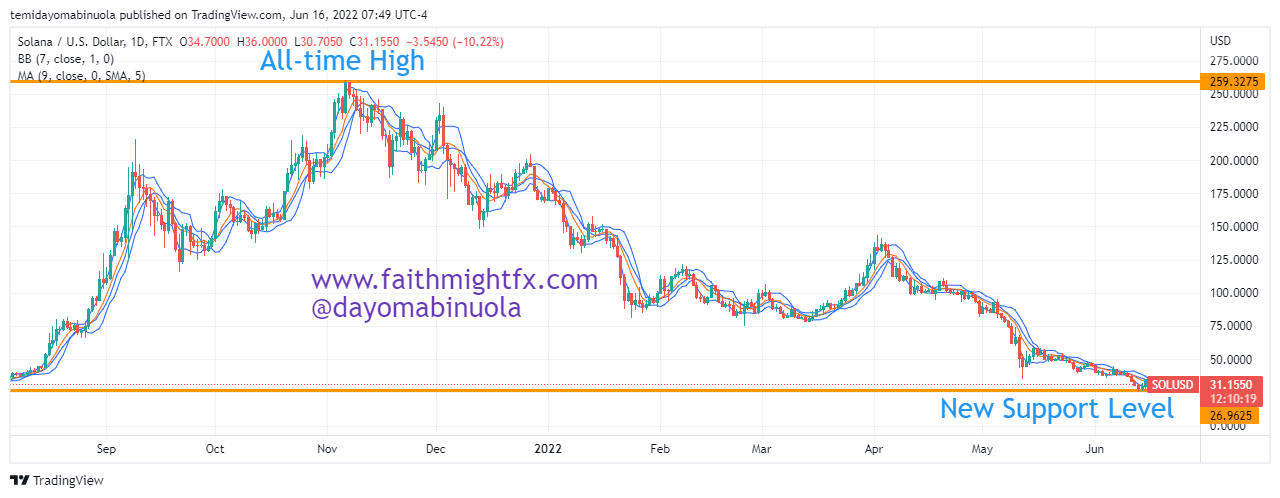
Daily Chart
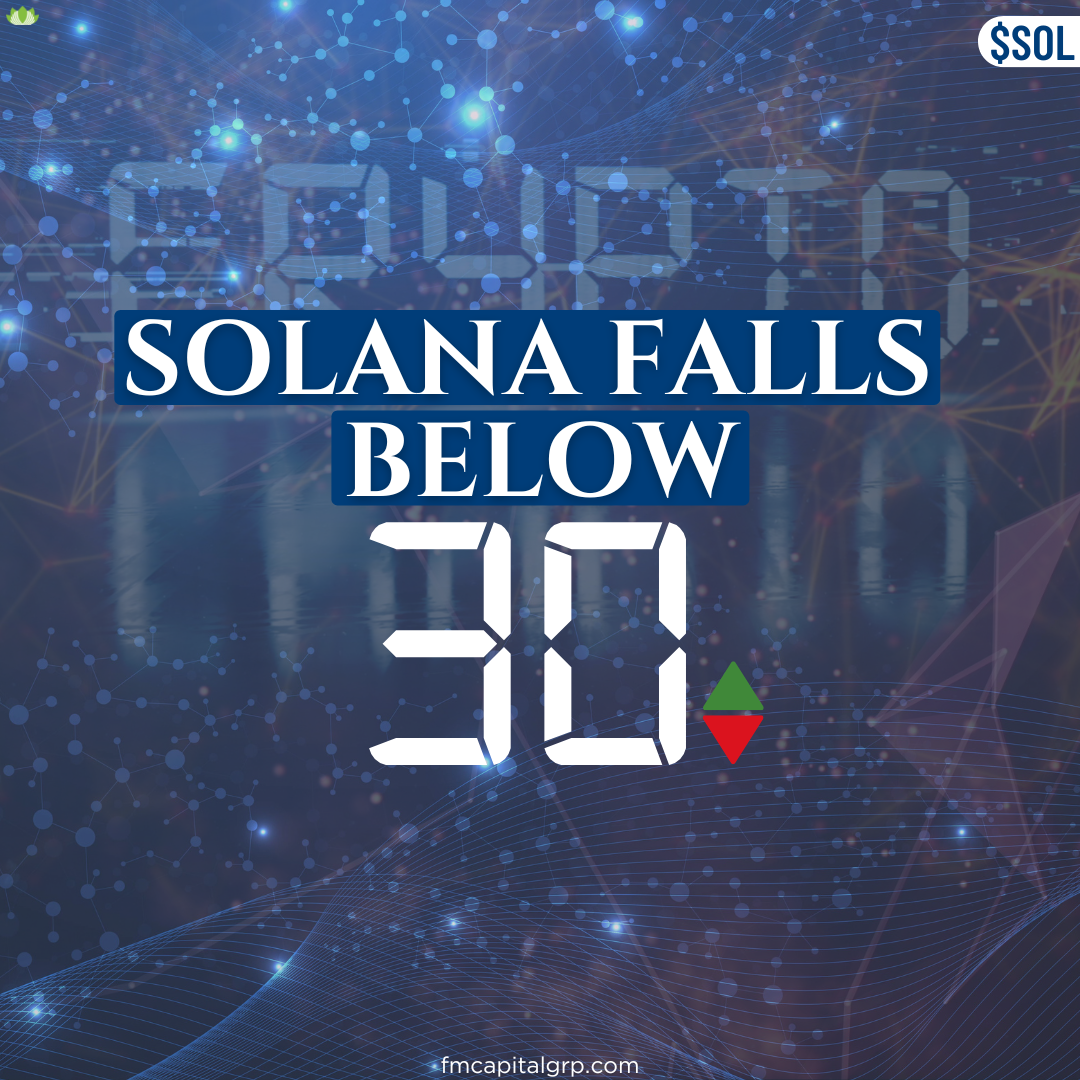
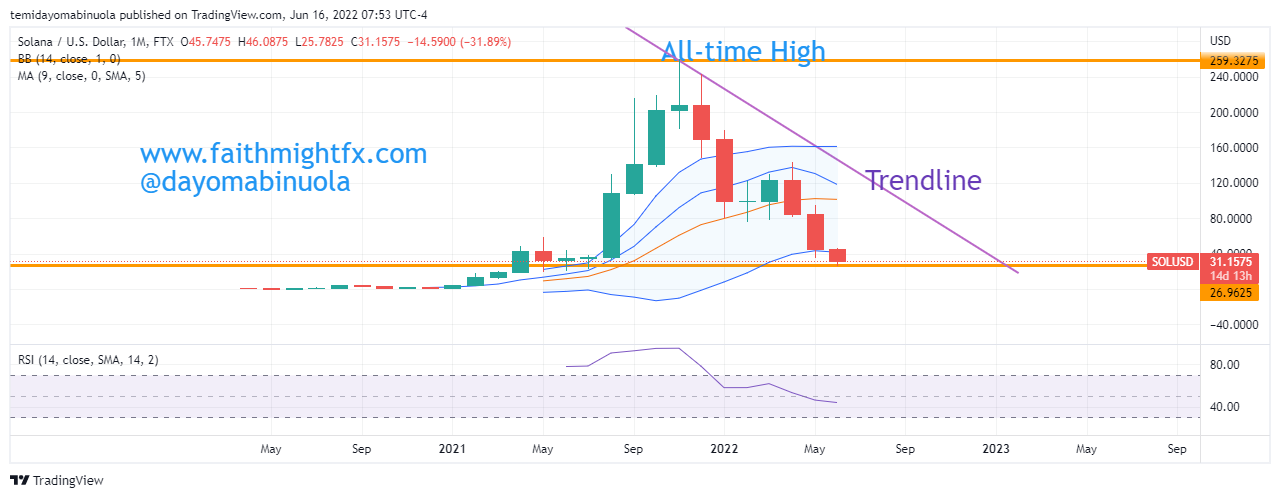
Solana is the 9th biggest cryptocurrency in the world by market cap, which stands at over $10.7billion. On the 13th of May, 2022, according to this article, Solana was at $52. Our analysts envisaged a continuous fall in price. On the 14th of June, price dipped to $25. The last time Solana price was at $25 was in July 2021, that’s about a year ago. Note that Solana reached an all-time high at $259 in November 2021.
Monthly Chart
The daily chart shows that the price of Solana has been oversold twice between May and June 2022 on the RSI. The NFT world has also suffered alongside this crypto crash. The value of all Ethereum and Solana-based projects have dropped across all boards. There are currently no indications of a price rally. The price of Solana is currently ranging, though the current price is at $31.395.
Some of these ideas are in our clients’ portfolios. To understand if this one can work for you or for help to invest your own wealth, talk to our advisors at FM Capital Group. Would you like more information on how to get cryptocurrencies in your portfolio? Schedule a meeting with us here
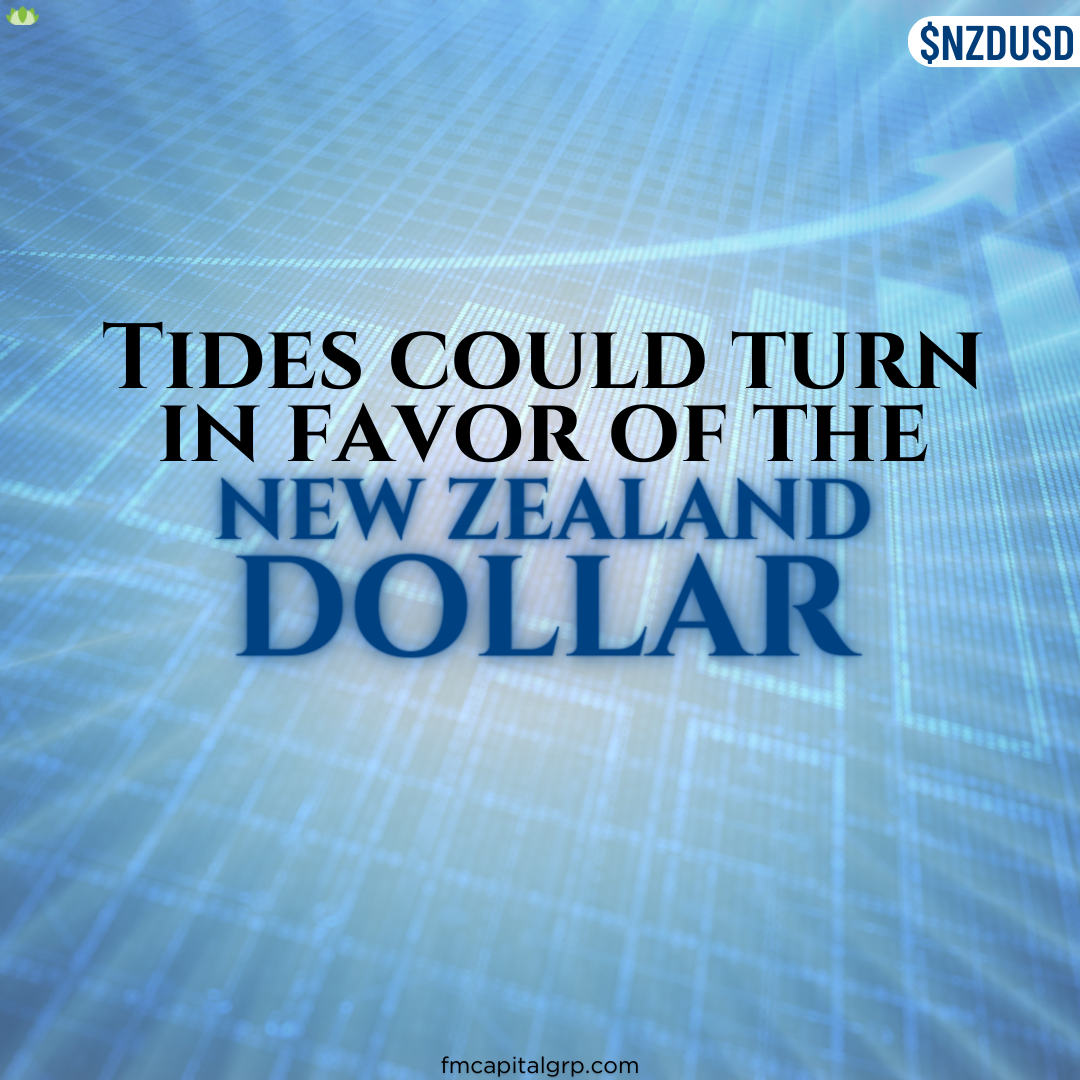
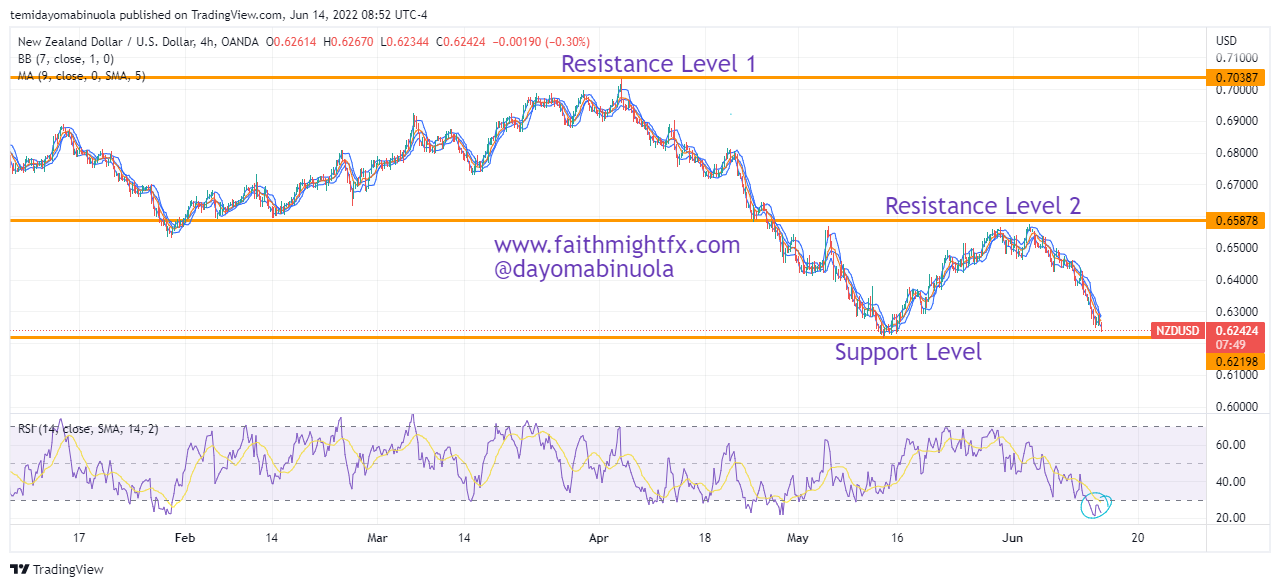
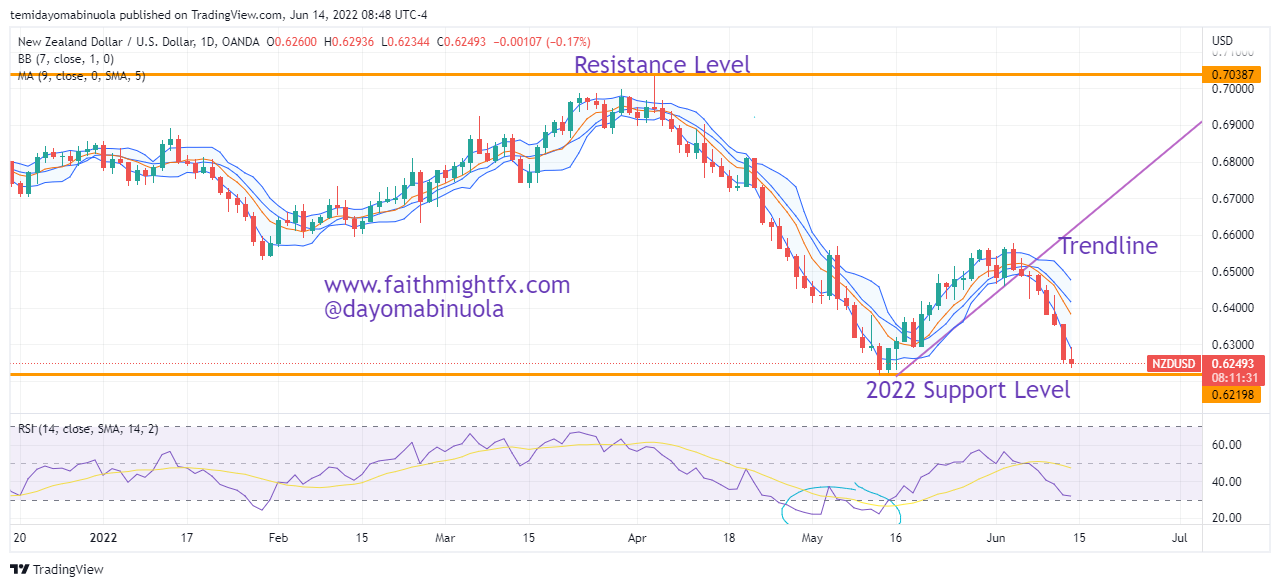
On May 31 2022, we published an article that the NZDUSD bears will stay dominant. This turned out to be the case and furthermore, the forecast we made was hit a few days ago. Across the board, the USD has gained against all major currencies.
4hr Chart
The support level of the year for NZDUSD is around 0.62205 and price fell this month to 0.62370 which is only a few pips above the support level. On the 4-Hour time frame, price is currently oversold. Also on the 4-Hour time frame, there are 5 dojis already formed which could be an indication of a possible reversal.
Daily Chart
For the past two weeks, all candlesticks on the daily chart have closed bearish. We hope that in the next few days, as consolidation comes up, price could rally and a trend could begin in favor of the NZD. We look forward to NZDUSD appreciating to 0.64613 from its current price of 0.62493.
Some of these ideas are in our clients’ portfolios. To understand if this one can work for you or for help to invest your own wealth, talk to our advisors at FM Capital Group. Would you like more information on how to get currencies in your portfolio? Schedule a meeting with us here