On the USDJPY monthly chart, it took it 12 years for a head-and-shoulder pattern to be formed. The first shoulder was formed in 2004, followed by the head in 2011, and the second shoulder was formed in 2016. After the second shoulder was formed, price ranged for 6 years before a major rally started. Despite the lockdown across the world in 2020, the YEN only gained the USD with few pips.
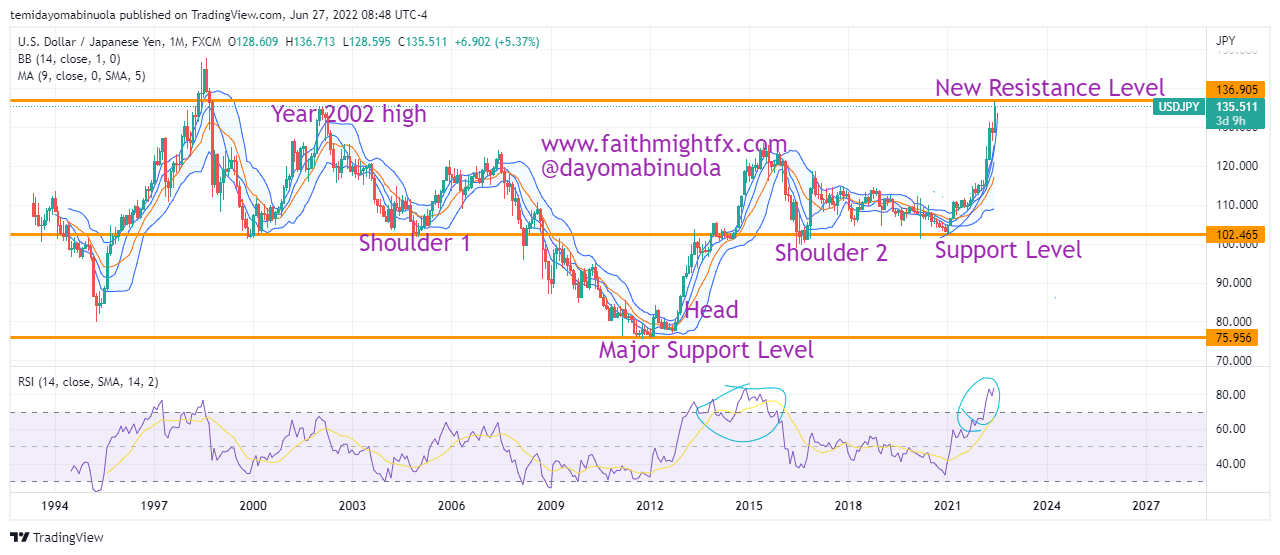
For the past 12 years, the USD has shown to be a stronger currency. The lowest price of $USDJPY was $5.956 in February 2012. The current price is at 135.508. The highest value of USDJPY since 2002 has been 135.126. Price was able to surpass the 2022 high few days ago after price reached $136.822, the highest price since September 1998. A consolidation in price might occur has the USD dollar has been massively gaining against the Japanese yen since the beginning of 2021.
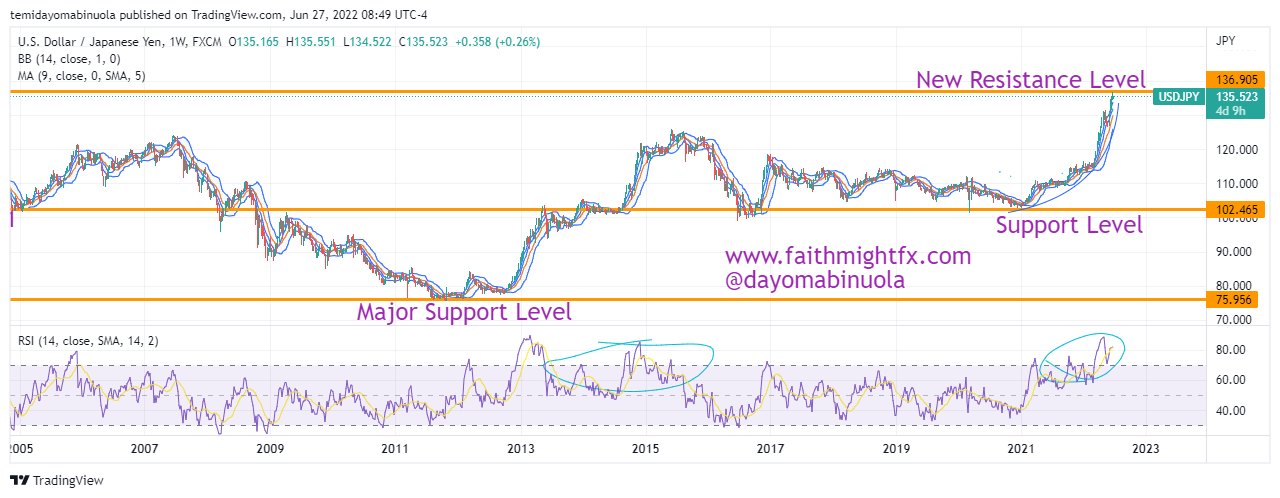
This expected price consolidation might make price fall, which could in favour of the YEN in the next few weeks. The price could be at 130.00
Some of these ideas are in our clients’ portfolios. To understand if this one can work for you or for help to invest your own wealth, talk to our advisors at FM Capital Group. Would you like more information on how to get currencies in your portfolio? Schedule a meeting with us here