fbpx

Who Wants To Buy TikTok?

The future of TikTok remains unknown. TikTok along ,with other popular Chinese based apps like WeChat, have come under scrutiny for its data sharing and alleged lack of data privacy. President Trump has ordered TikTok to either close its U.S. division or be acquired by another company.

Microsoft seems to have gained the most attraction to the app due to its user data potential while adding yet another platform to attract more consumers to its constantly expanding software capabilities. Despite Microsoft seeming to be the company that will buy Tiktok, Twitter has recently sparked an interest into the social media app as well.

Twitter over the years has gained attraction among users through its live streaming capabilities combined with its real time newsfeeds. Twitter has also more recently gained the spotlight through its newly enforced censorship policy regarding misinformation, which has been a catalyst for social media platforms to combat the spread of fake news. These defining attributes are what gives Twitter a leg-up on Microsoft and allows Twitter to easily integrate TikTok into its platform.

$TWTR has relative short-term strength with no foreseeable long-term gains.

According to our chart, $TWTR has had some similarity to $MSFT with its downtrends and corrections from the major March dip. On the contrary, $TWTR has been known to be the “underperformer” among other social media stocks. This is due to $TWTR history of having weak earnings its inability to break its lowest correction lows, and the never-ending political atmosphere that surrounds it. Based on the RSI and H, it is apparent that $TWTR can either be weak and volatile or steady with few and far corrections in between.

Overall, we believe $TWTR in the long-term investing won’t be a huge gainer but steady in terms of price gains with occasional lengthy troths. As for the short-term, we think that $TWTR performs its best under distress especially with the pandemic combined with its political affiliations. Therefore, gains can certainly be made in the short-term especially with $TWTR pattern of gaining before correcting itself.

The Future of TikTok

The popular social media app TikTok has taken millennials and Gen Zers by storm during the pandemic. It has become the video-sharing app of celebrities and influencers and has become a past time similar to scrolling through Instagram and Snapchat. TikTok has also, in recent months, become leverage of political warfare.

ByteDance (TikTok’s parent company) first began causing controversy in India. India banned TikTok for two weeks after border disputes between China had caused an insurrection between the two nations. As a result of this combined with the ongoing tariff war between the U.S. and China, President Trump announced earlier this week about dismantling TikTok due to potential data breaching. China, for years, has been known to tamper with U.S intellectual property. Now with its recently passed security laws, this could be something to carefully look at.

From an investment standpoint, ByteDance has no plans of releasing an IPO and is thought to be overvalued. This is because the app’s popularity recently gained serious attention and still has problems with much-needed consumer retention, especially outside of mainland China. Despite these shortcomings, there are still signs of potential growth with its recent attention through the media. This has especially been made apparent with Microsoft drawing interest to acquire the app. Microsoft wants TikTok because of its data potential. It was announced that Microsoft is heading into a deal with ByteDance for TikTok. It is simply now waiting for final approval from the U.S. government.

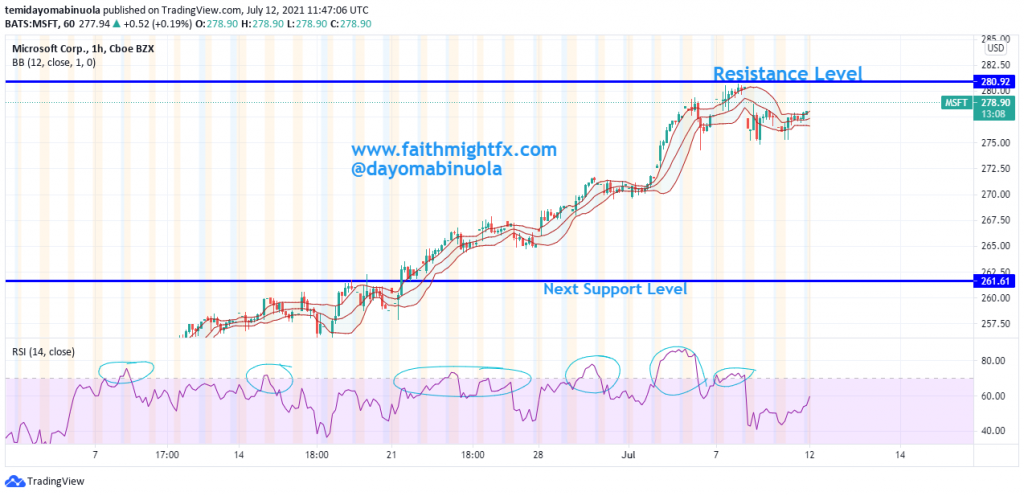
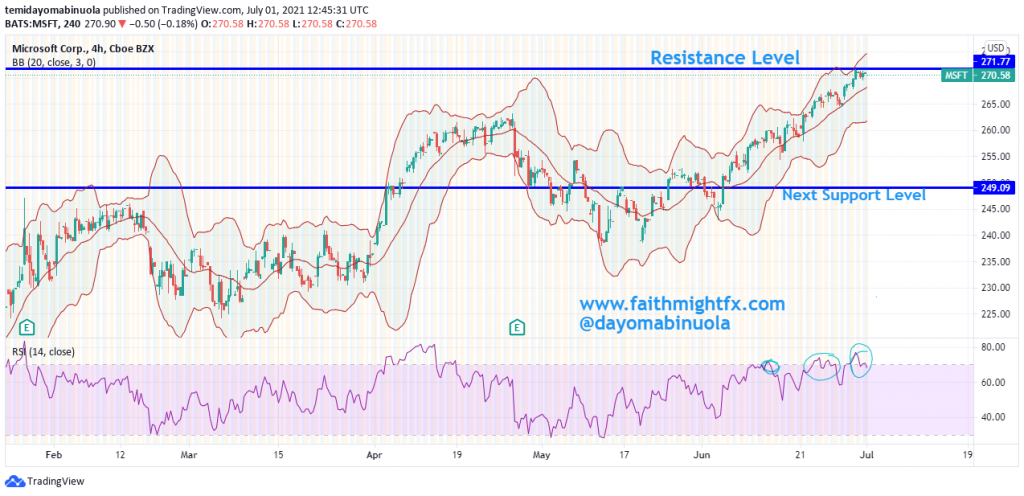
$MSFT has potential to be a great long-term buy.

After crashing to lows along with the broader market in mid-March, $MSFT bounced back and increased users among its Microsoft Teams video app and with its Xbox. This could also be attributed to its steady but consistent RSI at 60. Which expresses no giant volatile troths but does show uptake of more buyers coming in while still showing slight contractions which therefore confirm our Fib sequences. The recovery in price is supported by consistent RSI. Although, the contraction in price is being confirmed by the bearish divergence between price and momentum (RSI). Overall, $MSFT is clearly in an upward trend with the potential to continue to drive higher in the long-term. In the short-term, according to our highlighted Fib sequences and the bearish divergence between price and momentum, there looks to be some slight contraction before it starts to really prove its gains.

Investing in the Fear Index

The $VIXX, a.k.a Fear Index, has been a prime indicator to determine where the market is headed, especially when uncertainty is apparent and abundant. It’s typically used as a benchmark or what’s called an intraday indicative (IV) which can even help track and predict where the market is heading. During the height of the pandemic, $VIXX was nearly up 500% because of the devastating effects of COVID-19 on the economy. $VIXX usually trades on average between $25 – $30, but through March was trading around $80! $VIXX just closed yesterday at $29.34, but I believe has a chance to rise again because of the continued uncertainty combined with the wavering effects of the pandemic. Check out $VIXX through 2020 alongside the S&P 500 below to see its stellar performance.

Can Dollar Weakness Finally Trend?

I have been harping on USD weakness for months now (here and here and here). Amazingly, during that time with poor U.S. economic data releases and stocks recovering, the USD has remained rangebound. Bouts of weakness have been met with strong bouts of buying since April. When looking at the $GBPUSD, the 1.2634 resistance level has remained that line in the sand for buyers and sellers. Until we get a break above 1.2634 that stays above the 1.2775 resistance level, we won’t see sustainable selloff in the USD.

GBPUSD DAILY CHART

Despite the jockeying between buyers and sellers, the $GBPUSD is trending higher with higher lows and higher highs. This indicates that the USD does continue to weaken more and more. A hold above the 1.2775 resistance level will see the $GBPUSD head towards the highs on the daily chart above the big 1.3000 level. However, another false break above 1.2634 could send $GBPUSD back into a correction that targets the 50% Fibonacci level at 1.2114 or lower.


If you are interested in learning how to find and use these levels in your trading, please check out the CHARTS101 course. Read the charts for yourself so you can trade what you see and not what I think.

Black Lives Matter Fuels New Interest in Stocks of Black Businesses

Given the demonstrations for justice and the humanity of Black lives, stocks of Black owned businesses have now caught the eyes of traders recently. I had a client turn my attention to Urban One ($UONE) a couple of weeks ago.

While I’m familiar with the company and its founder, Cathy Hughes, I didn’t know that it was publicly traded company. After spending some time doing the fundamental analysis, it is my opinion that the company is well managed and could get a lift in revenues with all this new consciousness coupled with the political ad buying season ramping up. Satisfied with my fundamental analysis, I took a look at the chart.

UONE DAILY CHART

While trading under $10 for nearly 14 years, the stock exploded to new 52-week highs on June 16th. Traders piled in not long after taking profits to push the stock to new all-time highs on June 19th – Juneteenth, naturally. Traders quickly took profits again at the $54.16 high. Despite breaking below the 61.8% Fibonacci retracement level, which signals a reversal back to lows, price still managed to settle above the $18.10 support level. As long as price can remain above support, $UONE can move higher. But a break below the $18.10 support level can see price quickly fall lower to the support zone at $10.21-11.25.

Now rumor has it that price could explode higher again tomorrow on July 7th. Why? July 7th is Blackout Day 2020.


If you are interested in learning how to do fundamental analysis and find levels in your trading, please check out the CHARTS101 course. Read the charts for yourself so you can trade what you see and not what I think.

How Do You Trade The Breakout Stock

$ETSY is on a tear. After dropping past its 2019 lows during the COVID-19 stock market crash, $ETSY has since skyrocketed to new all-time highs. Price broke above $100 for the first time ever last week. And hasn’t really looked back.

We’ve been buying $ETSY since it was trading in the teens. So the questions becomes how do you put new money to work in an asset that is experiencing such an incredible run up in its price like $ETSY has? The short answer is I wait.

I know that sounds strange but trading forex has hardened me. I just don’t chase price action. A correction always happens…in the forex market. That’s not necessarily the case in stocks. The trader in me can underestimate the effect of good (or poor) company management on stock prices. And Etsy is a very well-run company. Has been for years. Change your timeframe to long term then any price below $100 has been a good chance to buy.

If you already have a position, be patient and wait for Etsy to pay a dividend 🙂


If you are interested in learning how to find and use these levels in your trading, please check out the CHARTS101 course. Read the charts for yourself so you can trade what you see and not what I think.

ON THE AIR with Market Overtime with Nicole Petallides

I joined Market Overtime with Nicole Petallides to talk about the longer term trends presenting right now in the currency markets. This was my first time on the show. Weak GBP remains the prevailing theme in forex right now. Listen to hear why. Enjoy!


If you are interested in learning how to find and use these levels in your trading, please check out the CHARTS101 course. Read the charts for yourself so you can trade what you see and not what I think.

ON THE AIR with F.A.C.E.

Today, I spoke live with over 200 traders in the Forex Analytix Community Experience (F.A.C.E.) about what the opportunities are in GBP for the new trading week ahead. With multiple pairs ending the previous trading week at major support levels, there were several great opportunities to share with traders live in the market on camera. That’s always great. I hope everyone who caught me live is doing some trade management now on those trades. We have some great moves already in the $GBPUSD and $GBPJPY. In case you missed it, do study the replay below.


If you are interested in learning how to find and use these levels in your trading, please check out the CHARTS101 course. Read the charts for yourself so you can trade what you see and not what I think.

Is the Yen Telegraphing More Risk Ahead?

The $GBPJPY took a beating over the past 2 weeks since topping out at the major 140.00 resistance level. Last week, in particular, after a bounce off the Fibonacci levels, the $GBPJPY found sellers again, this time, at the 136.46 resistance level. Sellers pushed price lower from that resistance level to end last week at 131.73, just ahead of the 131.55 support level.

As the new trading week opens and gets underway, the $GBPJPY has remained above the 131.55 support level. But taking a look at the weekly chart, we see that the selloff last week has really just been a correction lower right into the 50% Fibonacci level at 131.95. If risk aversion subsides this week, the $GBPJPY could bottom here and begin to rally. A rally in the $GBPJPY could signal a rally in stocks as markets are willing to take on more risk aversion.

A move back above 140.00 targets the 123% Fibonacci extension at 143.34 which also finds confluence with the 143.78 resistance level. A move below 131.55, however, signals a move lower towards 124.00. And this would see stocks continue to languish and possibly accelerate lower. Keep your eyes on yen!


If you are interested in learning how to find and use these levels in your trading, please check out the CHARTS101 course. Read the charts for yourself so you can trade what you see and not what I think.

What’s Going on With the U.S. Dollar

With everything the Fed has done to loosen monetary policy, the USD should be far lower. But the reserve currency is in high demand during this time of disease and civil unrest. Though it will be a back and forth, tug of war, I still believe that the USD weakens in the face of unprecedented expansion of the Federal Reserve balance sheet.

GBPUSD 1 HOUR CHART, JUNE 16

This is a short-term view of Tuesday’s price action in the $GBPUSD. After bottoming below the 1.25 level, cable managed to rally over 200 pips before topping out at 1.2688. Upon Powell’s testimony during the U.S. session, the USD rallied as traders dialed down their risk appetite with price finding support in the Fibonacci levels.

Well, this is where $GBPUSD stands just a day later:

GBPUSD 1 HOUR CHART, JUNE 17

The break below the 61.8% Fibonacci retracement level is a signal for a move lower. But that will be highly dependent on how the market reacts to the Bank of England monetary policy decision tomorrow morning.


If you are interested in learning how to find and use these levels in your trading, please check out the CHARTS101 course. Read the charts for yourself so you can trade what you see and not what I think.