The $USDCAD direction has an upward zigzag movement throughout this year. Price has been retesting on the resistance level several times this year. For the most part of 2018, price has been bullish. The USD obviously has been taming the strength of the CAD for some time. The highest price movement of $USDCAD this year has been at level 1.33419. The last time price touched this point was in June 2017. A bearish signal shows through the breakout in the trendlines, which tend to move downwards.
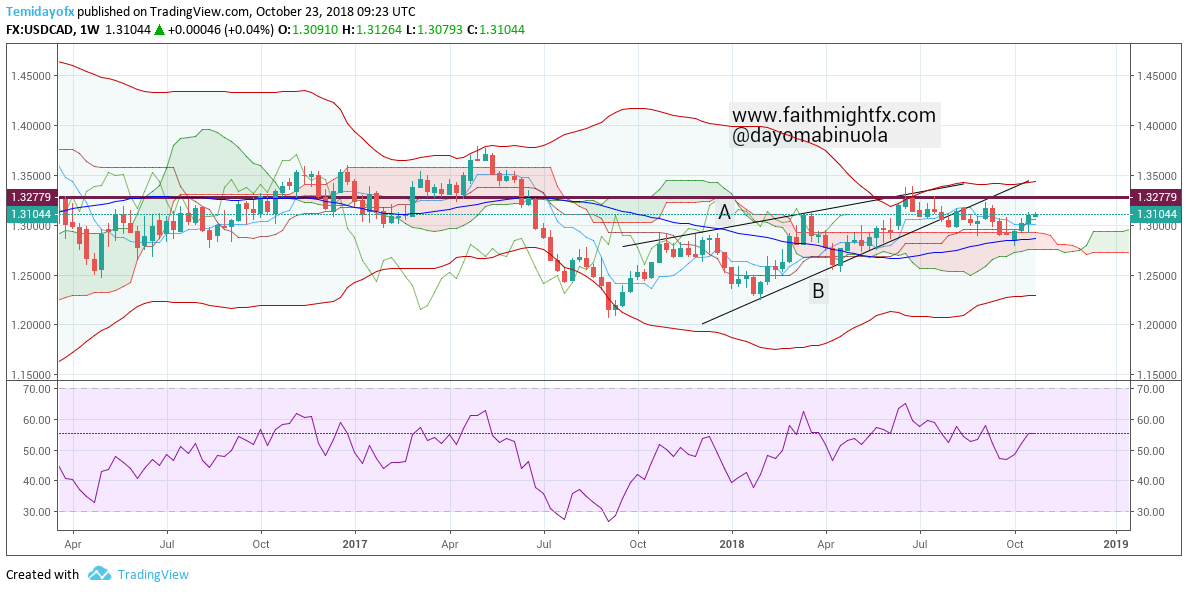
The Bollinger bands still holds price in the upper region of the bands. A reversal might happen anytime soon, which will make the CAD to gain more leading to a new trend downwards. Since RSI shows no trace of price being overbought, price has been able to touch the upper part of the band before touching the middle band line. Since a breakout occurred from the trendlines, price is meant to touch the lower band line in the coming weeks. As I expect bearish movement to start, this is dependent on sellers of the $USDCAD currency pair. The price of $USDCAD might reach 1.2840.
Given that price is still 500 pips away from there, this breakout to the downside could also be a fakeout.