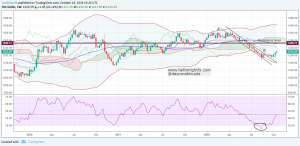
The price of Gold went down mid-April after several lower highs. Price was able to break the support level in August that resulted in a range in price. A look on the RSI indicates an oversold position since August which implies an upward movement of $XAU price. The last time price went this low to 1175.00 was in December 2016. Price of $XAU still maintains the lower section of the band despite indicators showing a reversal higher. Three weeks ago, price began an upward movement up until now.
The trendlines A and B have a breakout higher at level 1190.2. Price of $XAU is expected to touch the resistance level at 1280.71. This should occur in the coming weeks. The $XAU price movement was able to reach a ten-week high this week. A breakout of the resistance level could bring about a continuation higher in $XAU for a while longer. Investments in $XAU at this point could be a profiting one for buyers.

