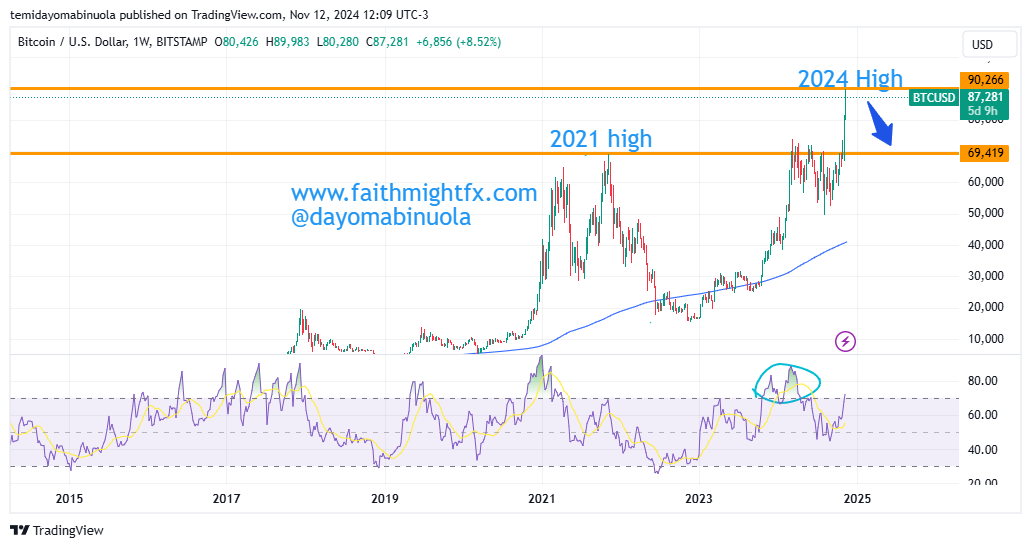
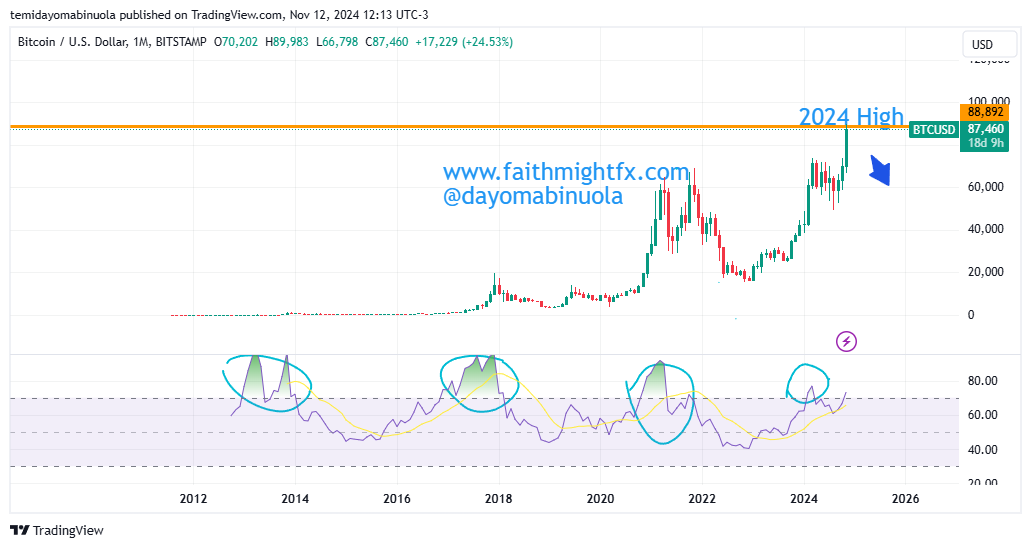
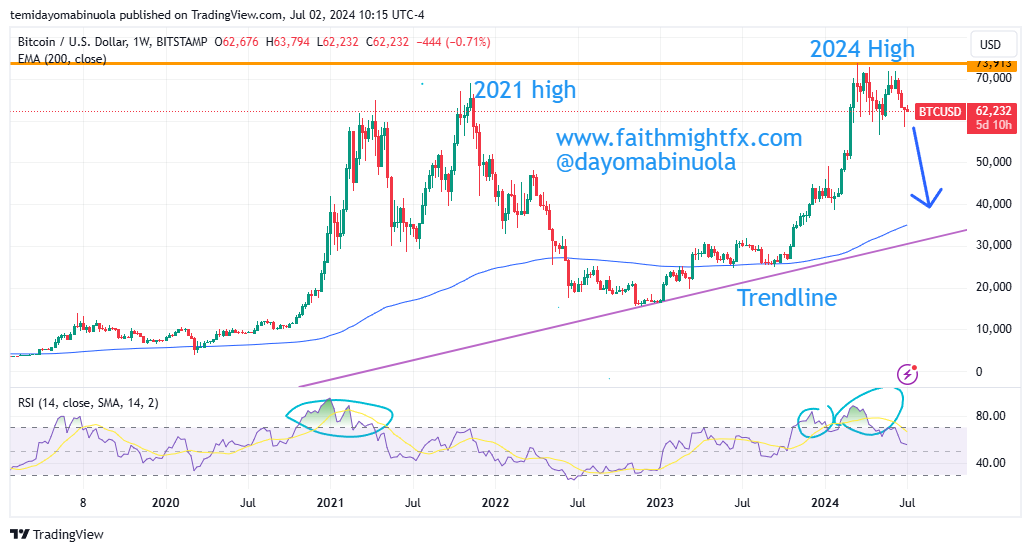
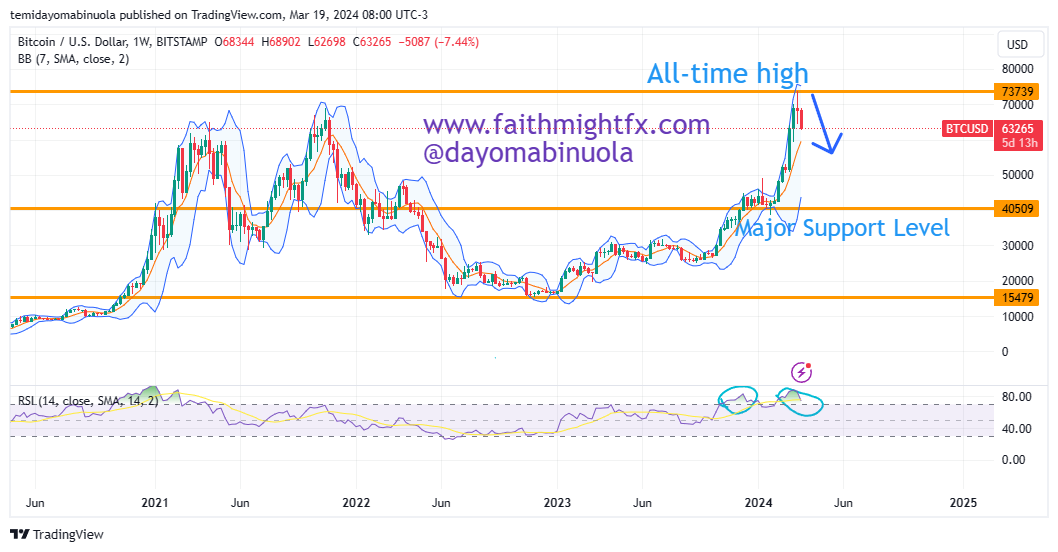
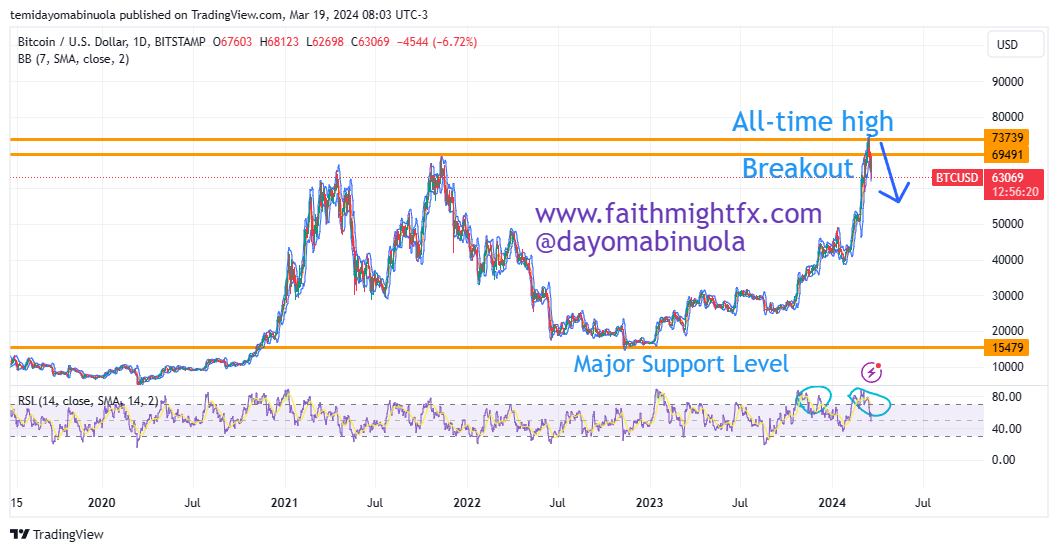
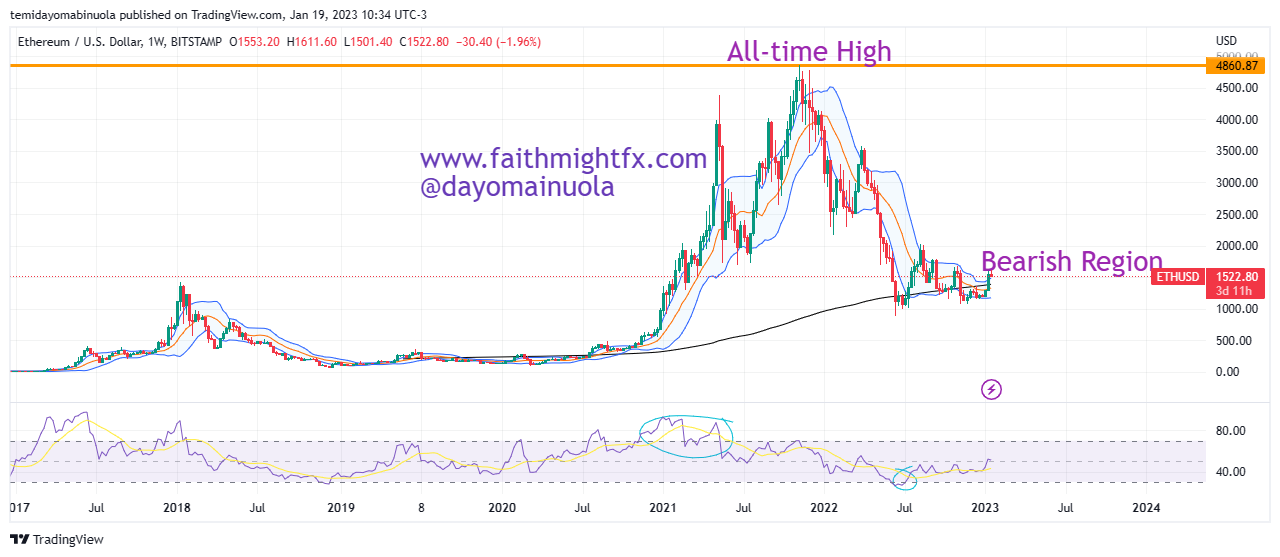
Bitcoin has continued its record-breaking run in 2025, perhaps edging ever closer to the moon. On May 22, 2025, BTC reached a new all-time high, surging past $110,000 to peak at $110,707 before settling around $109,800. This marks a 37% gain for the year and an impressive 140% rise from its 2024 low of $38,505. The rally was fuelled by renewed market optimism following the election of crypto-friendly Donald Trump, as well as sustained bullish momentum driven by strong capital inflows, the April 2024 halving, and macroeconomic factors such as inflation.
Several major firms have released bullish Bitcoin price forecasts, reflecting growing optimism in the market:
- Tom Lee of Fundstrat Global Advisors predicts Bitcoin could hit $250,000, driven by strong ETF inflows and a supportive U.S. regulatory landscape.
- Bitwise Asset Management sees a peak of $200,000, citing increased institutional investment and limited post-halving supply.
- VanEck projects a high of $180,000, though it cautions that market volatility remains a significant risk.
- Standard Chartered maintains a $200,000 year-end target, with the possibility of reaching $300,000 in 2026.
- Bernstein recently revised its forecast upward to $200,000, up from $150,000, expecting ETFs to eventually hold 7% of Bitcoin’s circulating supply.
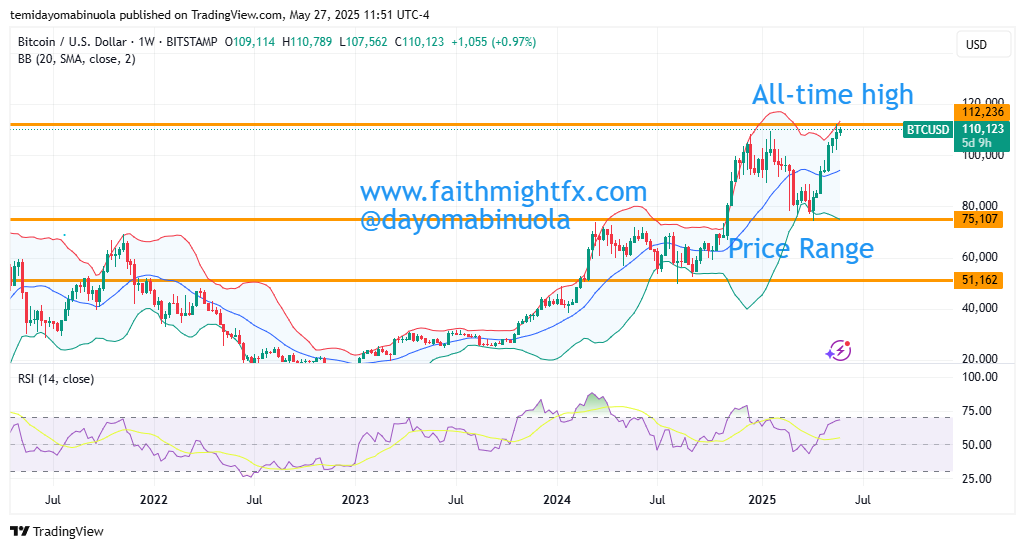
- Coinpedia forecasts a price range of $168,000 to $175,000, fueled by ETF demand and global liquidity dynamics.
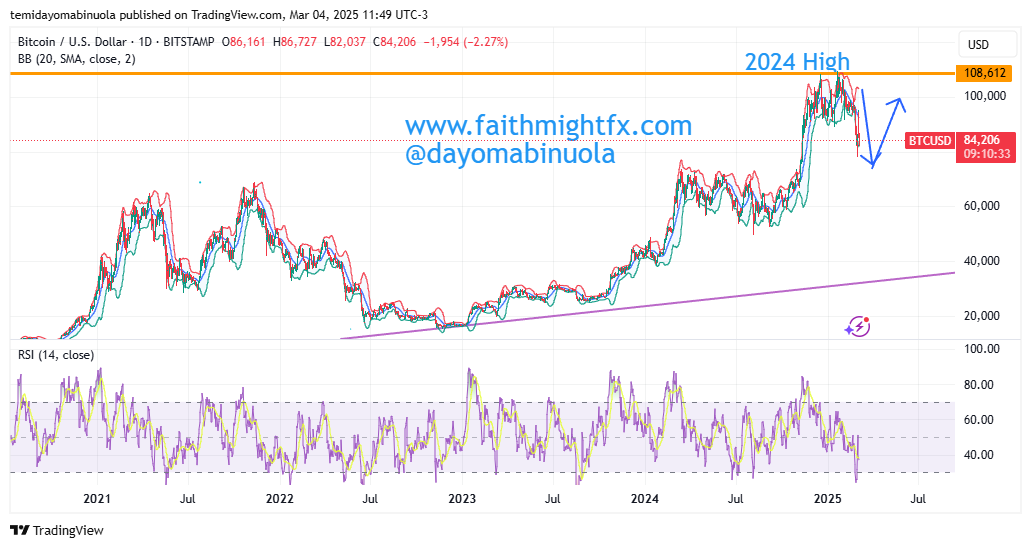
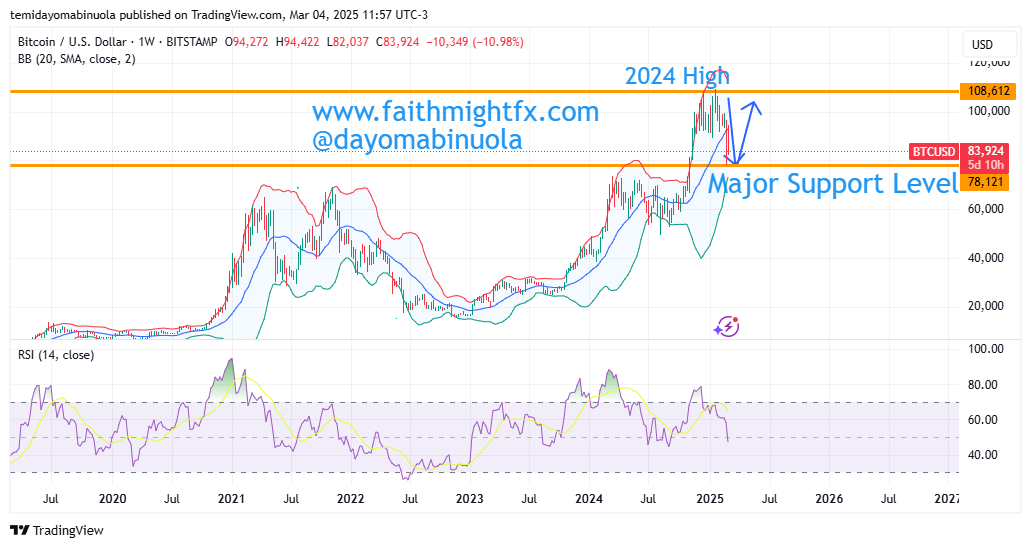
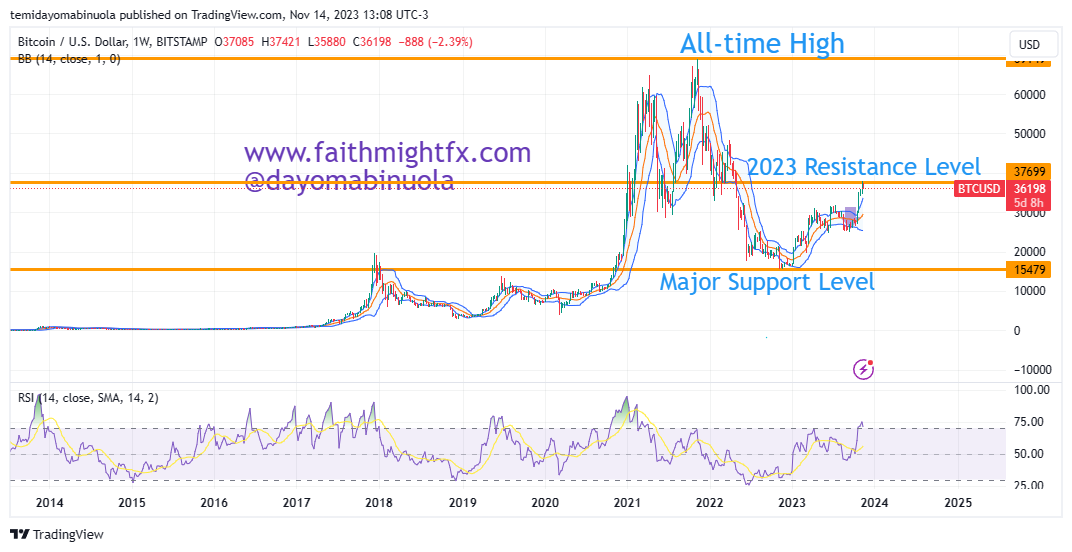
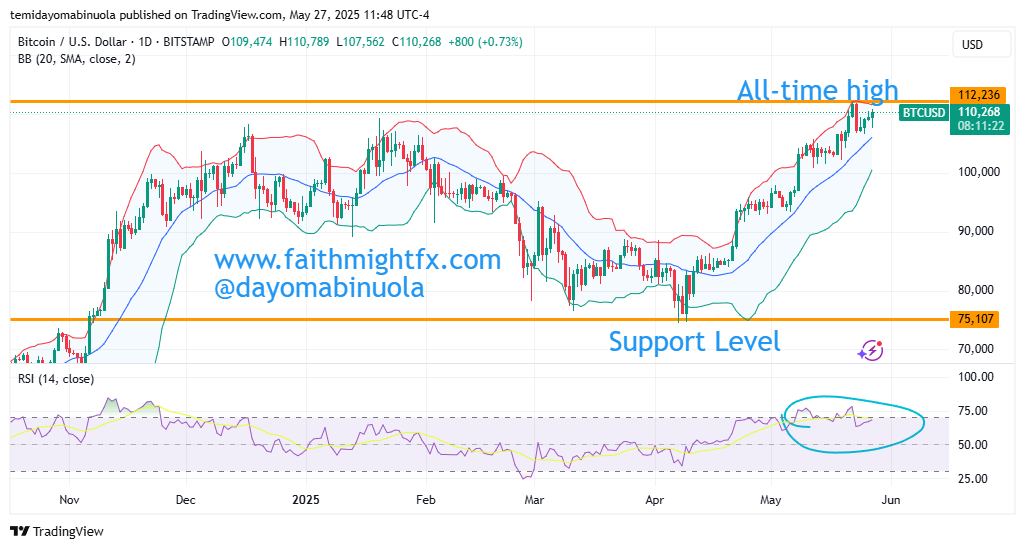
There are signs that Bitcoin’s price may face a correction, potentially dropping from its current level of $109,995 to $107,270. Both four-hour and daily charts indicate multiple instances of the price being overbought.
Some of these ideas are in our clients’ portfolios. To understand if this one can work for you or for help to invest your own wealth, talk to our advisors at FM Capital Group. Would you like more information on how to get cryptocurrency in your portfolio? Schedule a meeting with us here