fbpx

Bitcoin Drops To A New 2022 Low At $32,670

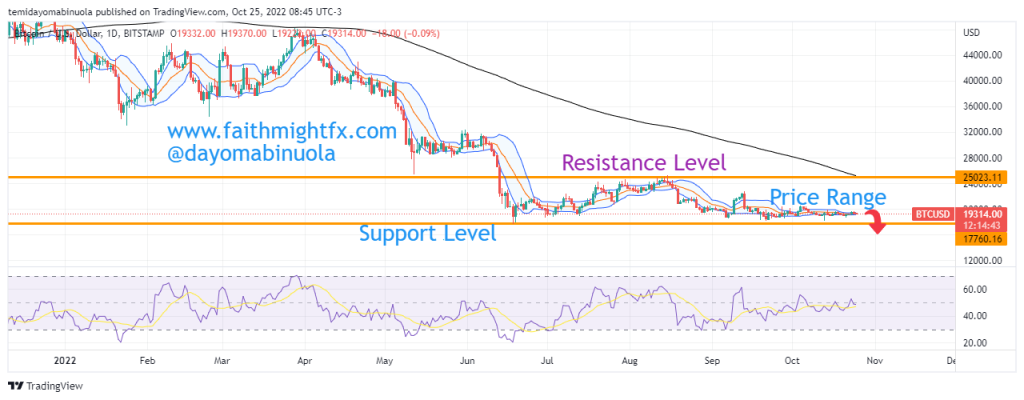
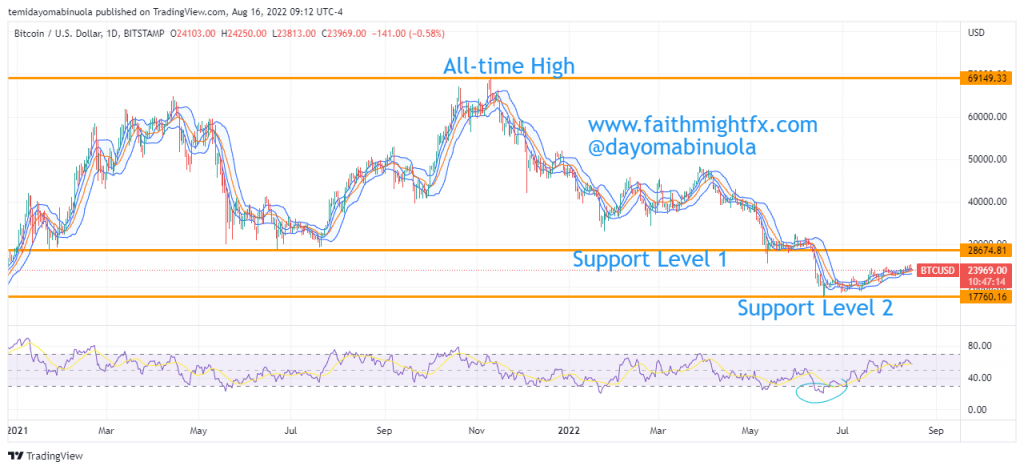
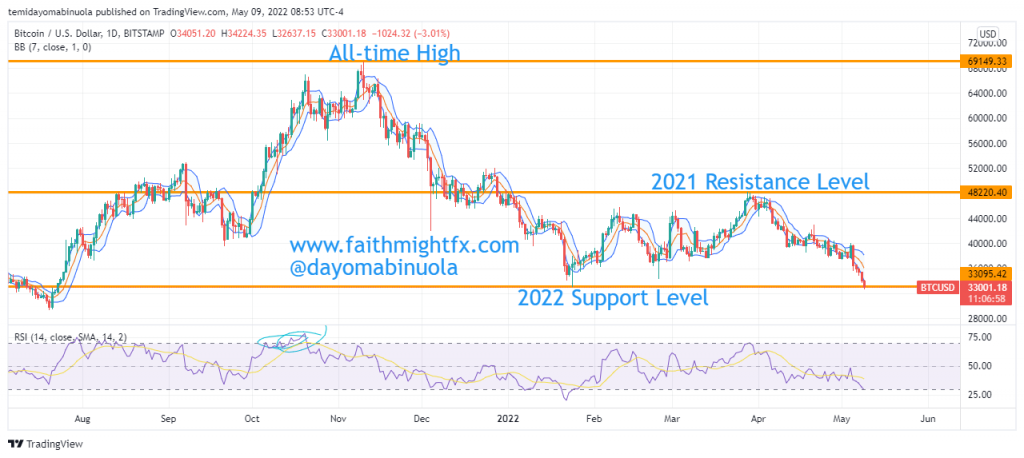
Bitcoin opened in 2022 at $46,196. At the end of January 1st, 2022, Bitcoin closed at $47,795. This price is the highest that Bitcoin closed for this year. Since the second day of the year 2022, the bears have been aggressive toward the Crypto king. In the last week of March 2022, the price rallied above the $48,000 psychological level but the price still maintained the highest close of the year at $47,795. While this rally was building up, the bears snuffed out the steam that was brewing in the bulls and dragged the price further downwards. 

Daily Chart

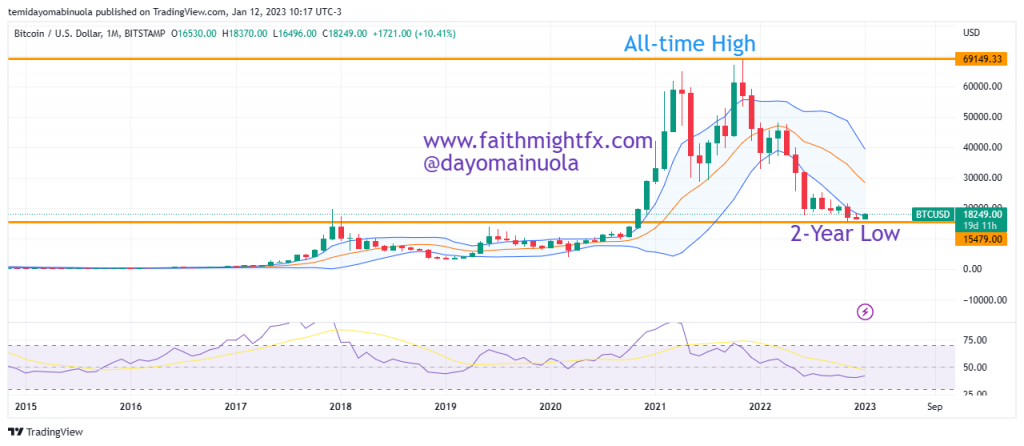
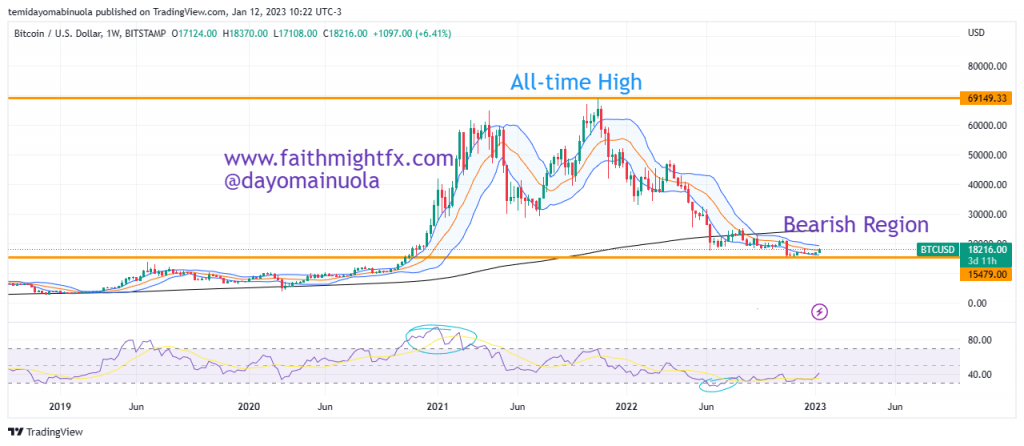
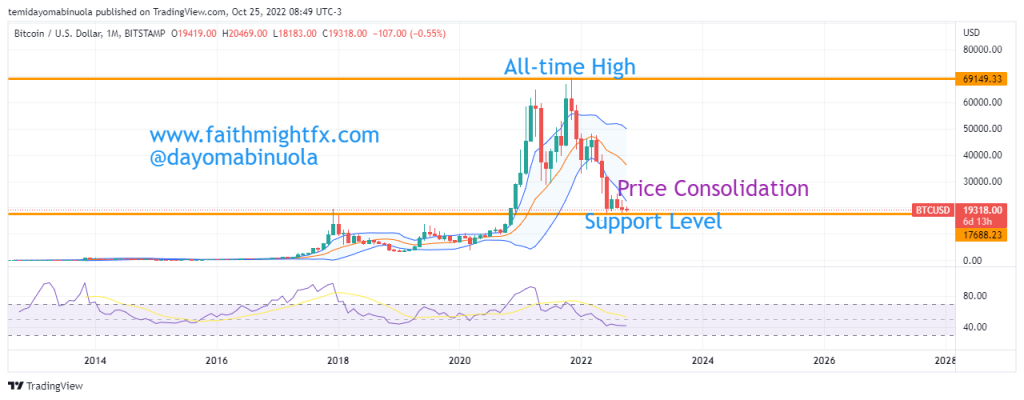
Back in 2021, the price of Bitcoin hit an all-time high of $69,000 in November 2021. Many investors and potential investors were looking forward to investing more at this point as analysts all over the world were forecasting a strong bullish run. But to their greatest surprise (and disappointment), Bitcoin’s bulls couldn’t hold the reins for long and the price began a descent that would last for the next three months. Candlesticks in November 2021, December 2021, and January 2022 all closed on bearish notes.

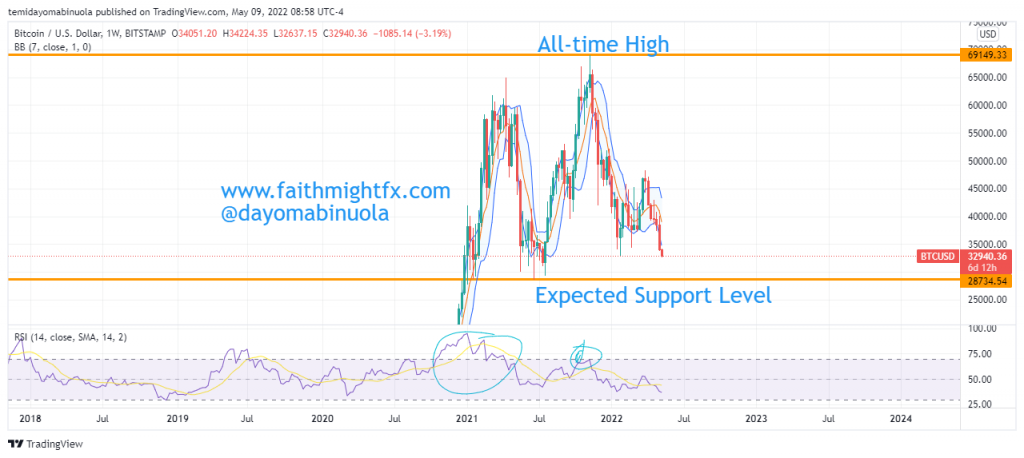
Earlier in 2021, El Salvador adopted Bitcoin as a legal tender and many analysts were optimistic of Bitcoin’s price reaching $100,000 as they expected other countries to follow in El Salvador’s footsteps. On October 12, 2021, we published an article on the dangers of Bull & Bear Traps. On that day, the price was $57,200. We made a forecast that Bitcoin’s price could go below $30,000. On November 19, 2021, following analysts’ forecast that Bitcoin could hit $100,000, we published another article reinstating our bearish stance. On that day when we published the article, the price was $58,229. Our analysts, however, were confident in the forecast that was made and we stuck to our prediction.

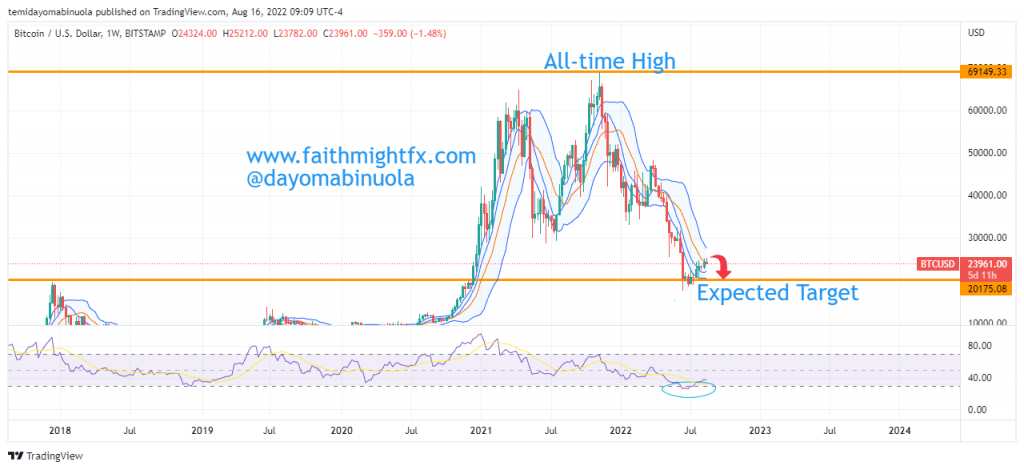
Weekly Chart

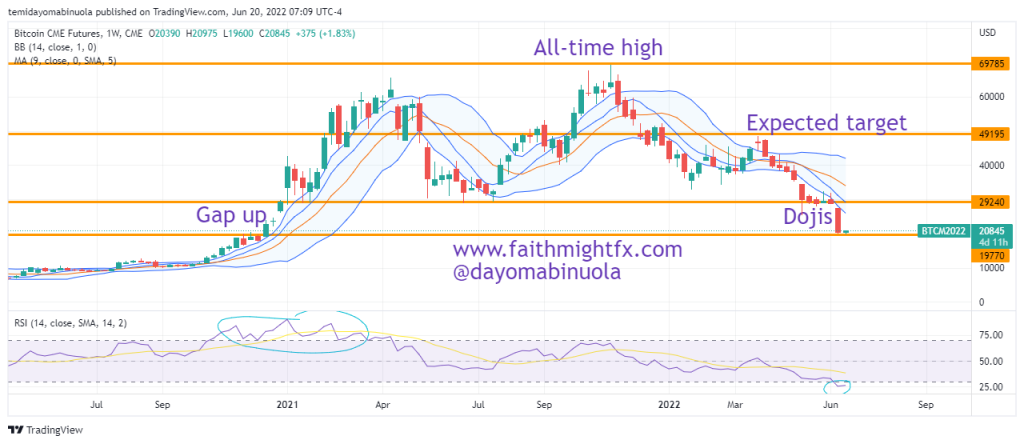
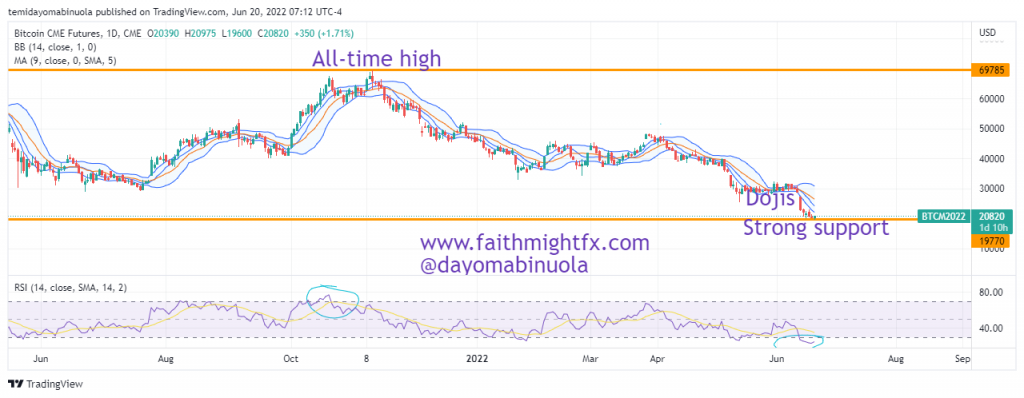
At the beginning of May, Bitcoin opened at $37,664 to reach May’s high of $40,000. But the past 7 days have been in favor of the bears and BTC has dipped below $33,000 making it hit the lowest point of the year at $32,670. Bitcoin’s current move is in perfect alignment with our forecast for Q4 2021 and we still stick to the call that BTC will go below $30,000.

Some of these ideas are in our clients’ portfolios. To understand if this one can work for you or for help to invest your own wealth, talk to our advisors at FM Capital Group. Would you like more information on how to get stocks in your portfolio? Schedule a meeting with us here.

The Dangers of Bull-Traps and Bear-Traps

A bull-trap is a false signal that shows a decreasing trend in a stock, currency, index, or other financial instrument has reversed and is now heading upwards, when in fact, the value of the security will continue to fall. Traders or investors that acted on the buy signal generates losses on resulting long positions.

A bear-trap on the other hand is a technical pattern that occurs when the performance of a stock, index or other financial instruments incorrectly signals a reversal of a rising price trend. The trap is thus a false reversal of a declining price trend.

Many traders especially lose money after being caught up in traps. Many investors have lost huge funds in traps. Traps sometimes might take months or years if a reversal occurs at all. Traps affect the mental health of traders and investors.

Avoiding Traps In Trading

  1. Practise risk management
  2. Never ignore the long-time patterns before making entries.
  3. Don’t try to be too early, no one awards you for being the first trader.
  4. Never get into a trade when market squeezes.
  5. Don’t trade the initial breakout, watch out for the next few candlesticks to confirm.
  6. Trade in the direction of the main trend

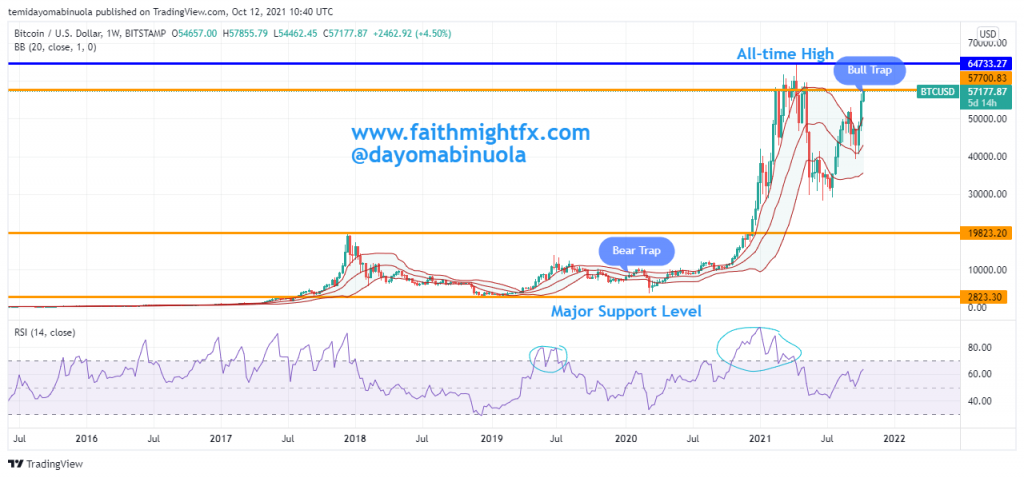
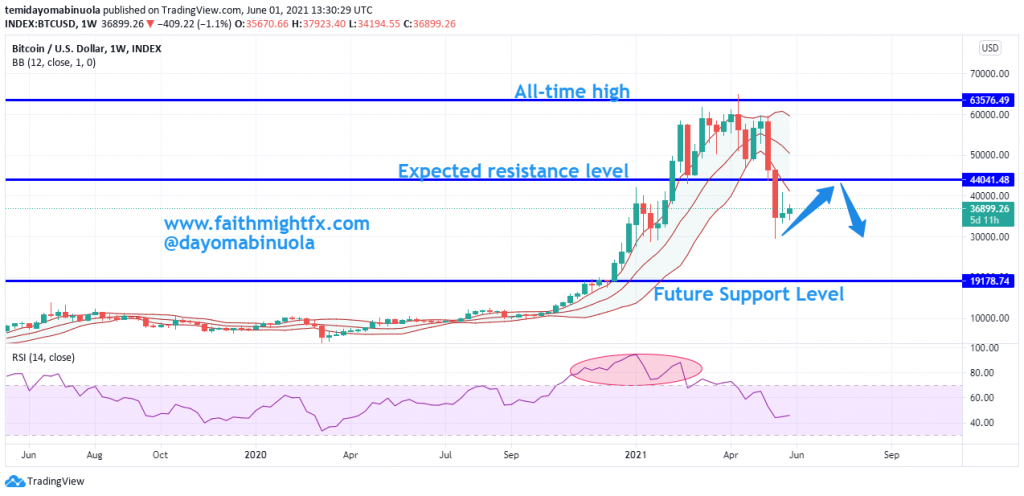
Taking a look at the BTC chart. In December 2020, the bulls broke out the initial resistance level in 2017 at $19,700. Ever since this breakout occurred, the price is yet to reverse. The closest reversal occurred in June 2021 when the price reached $28,300. I want to believe most BTC bears who shorted BTC in December 2020 must have been liquidated.

Also, the bulls reached a new all-time high in April 2021 at $64,700. Price reversed to $28,300 in June 2021. The bulls are back into more action as the price is currently at $57,200. Between February and May 2021, each time price opens above $57,000, it never closes above the $57,000. Traders and investors who invested above $57,000 must have been trapped. If the price reaches an all-time high, it ceases to be a bull trap.

THE NEXT CRYPTO BULL RUN: BITCOIN AND ETHEREUM

Since Bitcoin was launched in 2009, price has maintained a strong bullish movement with about 410,000% gain, from $0.09 in 2009 to its current price at $36,700. The current $BTC market capitalization stands at $678Billion.  Ethereum, on the other hand, is the second largest crypto with current market capitalization at $299Billion after its launch in 2015.

This signifies that most crypto assets are less than a decade. Ethereum has since its inception has been publicly accepted by Crypto traders and investors. Hence, the reason for the bullish movement. Just like other markets, the crypto market is a bull and bear market. High leverage usage must have wiped off some accounts due to greed. Currently, the crypto market is about $1.62Trillion with Bitcoin and Ethereum having over 61% of the market share. There are other thousands of cryptos newly introduced e.g. Ripple, Dash, Tether, Litecoin, Cardano etc. all of these make up the remaining 39% share of the crypto market.

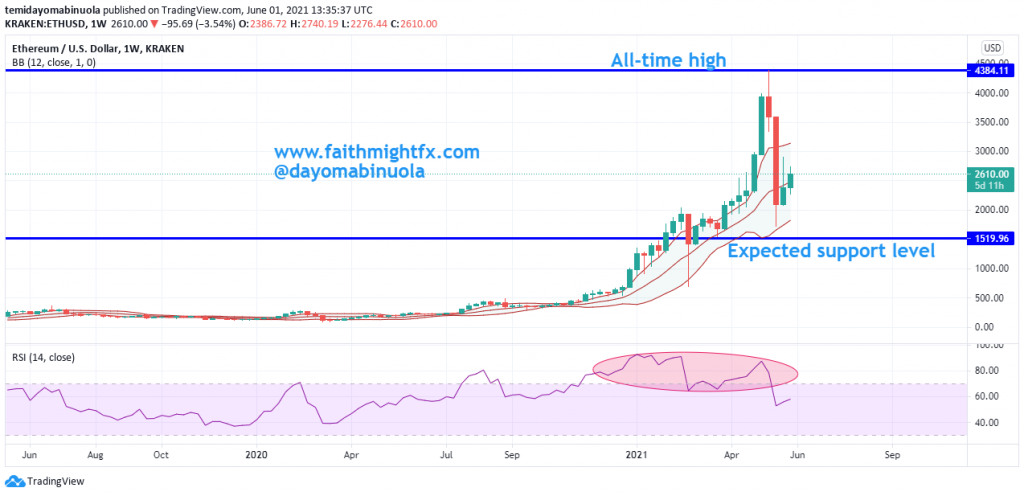
Bitcoin, in June 2020, was below $10,000. As at today, Bitcoin is above $36,000. Ethereum in June 2020 was below $300, the price of Ethereum today stands at $2,600. In the last one year, Ethereum has done far better than Bitcoin in investment gains. Both Bitcoin and Ethereum reached an all-time high in 2021. Ethereum reached $4,370 in may 2021 and Bitcoin reached $63,000 in March 2021. With Bitcoin and Ethereum having 61% of the total crypto market, they both have a major influence in the price movement of other coins. The increased acceptability of Bitcoin and Ethereum will determine the acceptability of other coins.

After the all time high was reached in March 2021 at $63,000, price was almost halved after it reached $31,200.

About $30,000 was wiped out in the price of Bitcoin last month, which made it the worst month in Bitcoin history with 41% lost from the highest price. Bitcoin has a very strong resistance at $43,980, a bullish breakout from this level might result in a fake out as price on the weekly chart is currently in the lower region of the Bollinger bands. The recent dip affected most of the assets in the Crypto market. Price of $BTC might rally towards $44,000, but the bears might push the price lower to reach $19,000.  If a dip occurs, this will reflect in the prices of other cryptos. The next dip might also push price of Ethereum to $1,500.

Bitcoin Bulls Are Becoming More Active

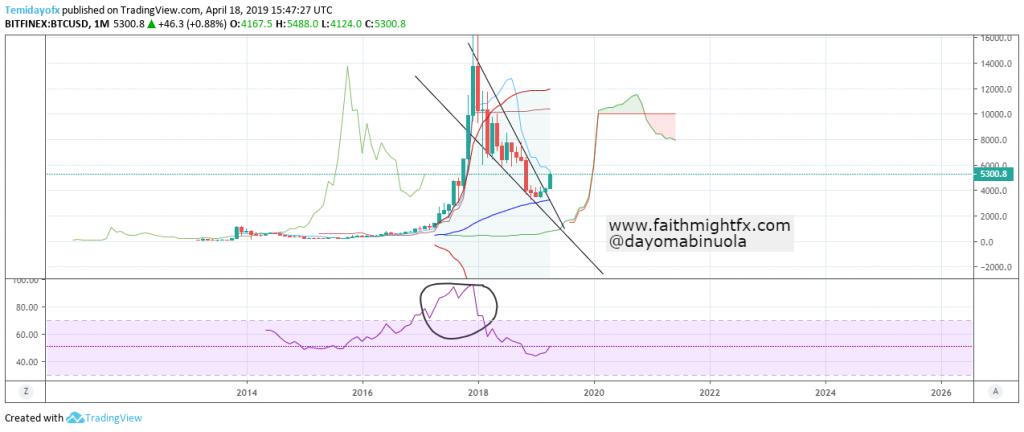
Almost all hopes were lost by investors when Bitcoin price took a dip. The year 2018 was hugely bearish for $BTC. $BTC’s dip was over 84% in a single year. In 2019, however, there have been low activities in the Bitcoin market. But in the last three months, the Bitcoin bulls are beginning to drive the market upwards. This recent upward movement might push the prices of alternative coins up. The price of $BTC on the Bollinger bands from the upper region of the bands is yet to cross to the lower region. A reversal might have just occurred because a breakout from the trendlines have occurred.

Bitcoin Monthly Chart

RSI is yet to show an oversold from the selloff which occurred last year. Ichimoku is yet to give a signal for a bullish move. With all indications, the price of $BTC might reach 10000 from its current 5,241. This might amaze you because hopes have been lost in the past few months. The long trendlines have been broken to the upward direction.

Bitcoin Might Fall Back To Major Support Level


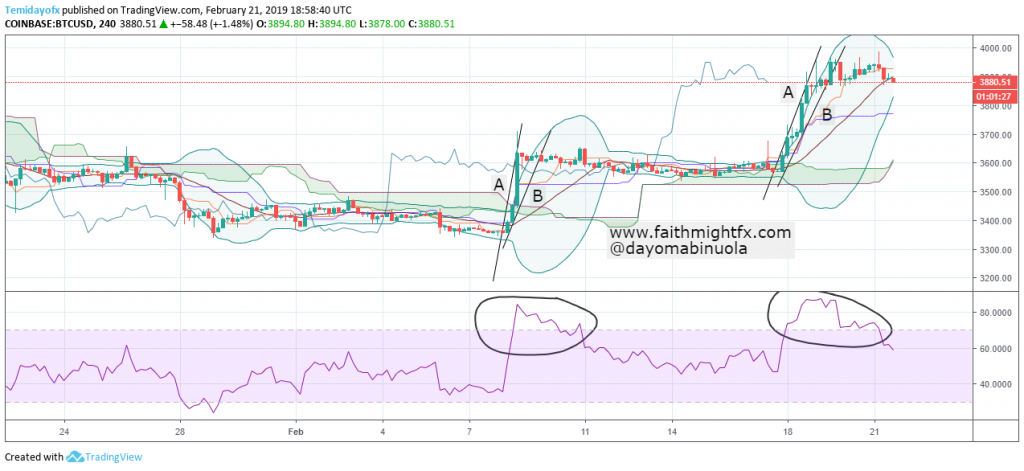
There was a sudden rise in the price of $BTCUSD on the 8th of February after a long range in price. Price initially was around 3360 before the upward movement to 3631 on the same day. After the bullish movement, a range in the price of $BTCUSD began. Two weeks later, $BTCUSD price began a bullish movement on the 19th of February which reached the resistance level of 3981.

On the RSI chart, price of $BTCUSD has been overbought at least twice in February. $BTCUSD price might fall to 3500 due to overbought positions. $BTCUSD bulls tried to move price about $600 in February. The bears seem to be in control of the Crypto world, giving little chances to the bulls. In the 4hr timeframe, price of $BTCUSD might fall about $500 in the next few days. Ichimoku is still showing a bullish trend which may likely give a reversal signal.

Crypto Lovers, Bitcoin Is Currently Oversold

Despite low volatility in recent times, there may be few huge profitable chances. To take a look at Bitcoin, the year 2018 favoured sellers. In 2018, $BTCUSD started at 13228 level and closed at 3665.33. There were several speculations from few experts that Bitcoin will continue the uptrend as in 2017 but it went all the way down in 2018. The highest point Bitcoin reached in 2018 was 17165 which was in January and the lowest in December at 3172.28. Many investors have lost interest due to the uncertainties of $BTCUSD thereby reducing demand. Due to the lower volatility, investors might not necessarily trade $BTCUSD for the long term.

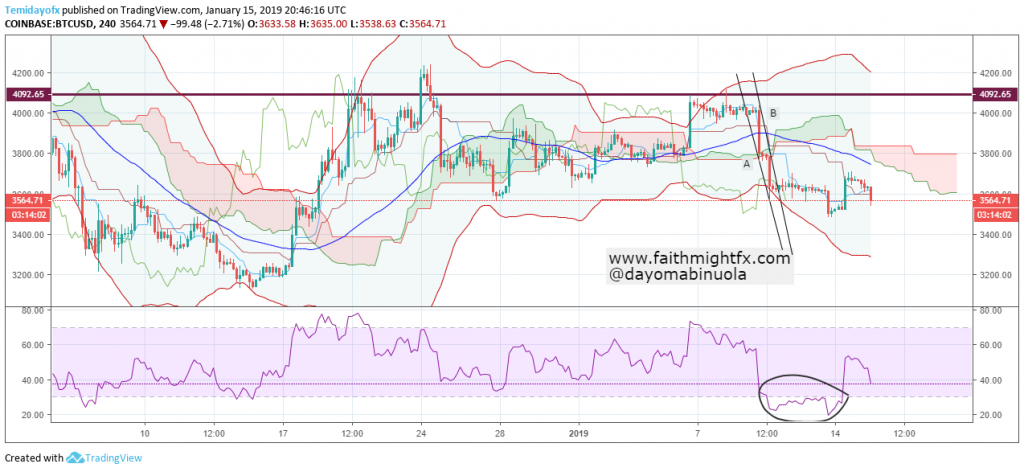
Bitcoin 4-hour chart

The first major bullish movement in the year might start soon if more buyers come into the market. RSI on the 4hr chart shows an oversold region for the past 5 trading days. Price is yet to cross to the upper part of the Bollinger bands but deliberate efforts of $BTCUSD buyers could push price to 4092 from its current 3564.