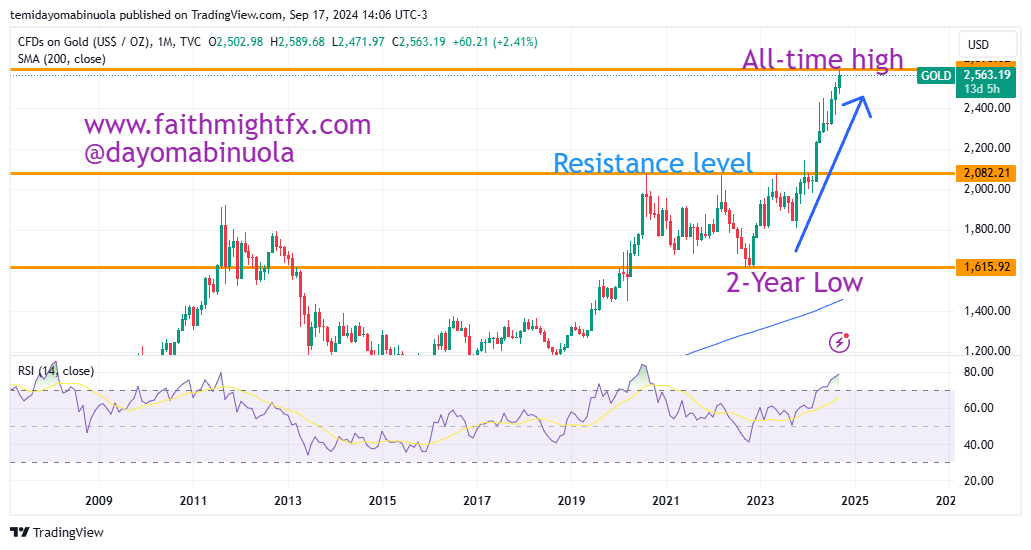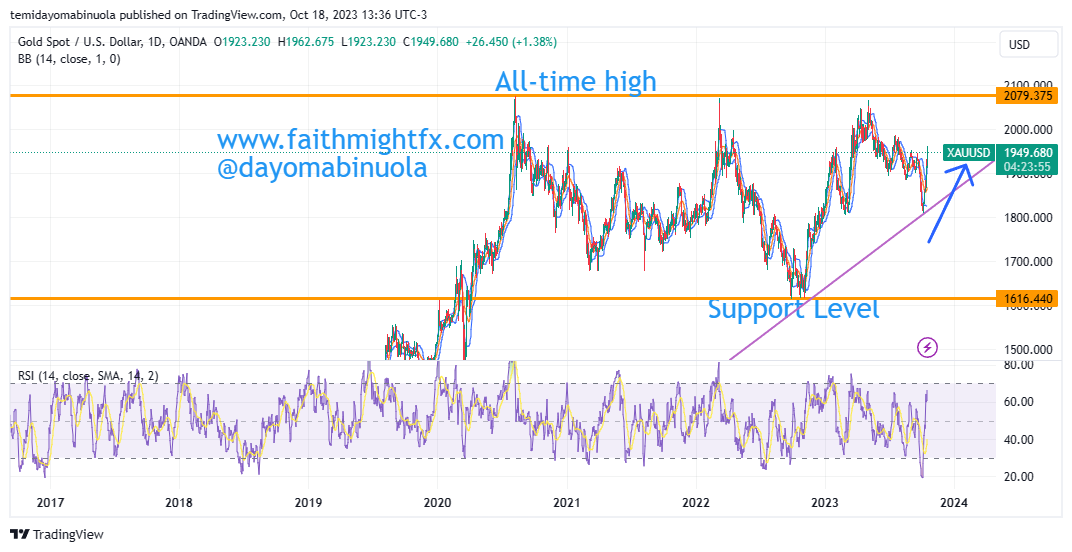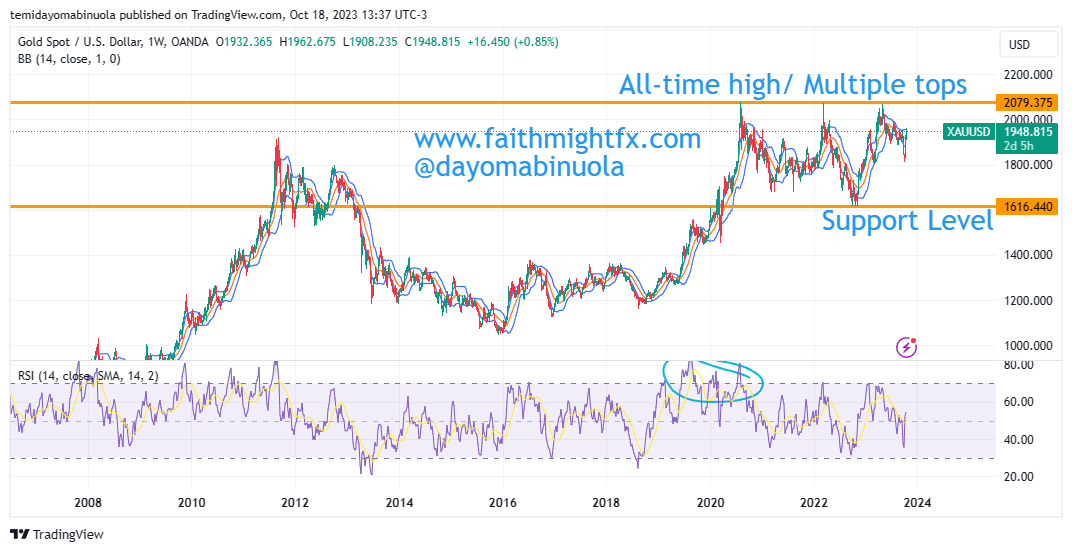
As of February 13, 2025, the price of gold has experienced a significant surge, reaching record highs near $3,000 per ounce. This increase is driven by factors such as central bank purchases, economic uncertainties, and geopolitical tensions.
Analysts have varying projections for gold’s future trajectory. Goldman Sachs forecasts that gold will reach $3,000 per ounce by the end of 2025.
In the investment sphere, gold mining stocks have not fully mirrored the metal’s price surge, presenting potential opportunities for investors. While gold prices have risen by 11% in 2025 following a 27% increase in 2024, gold mining stocks, have underperformed until recently. Analysts suggest that as confidence grows in sustained high gold prices, investors may turn to gold mining stocks.
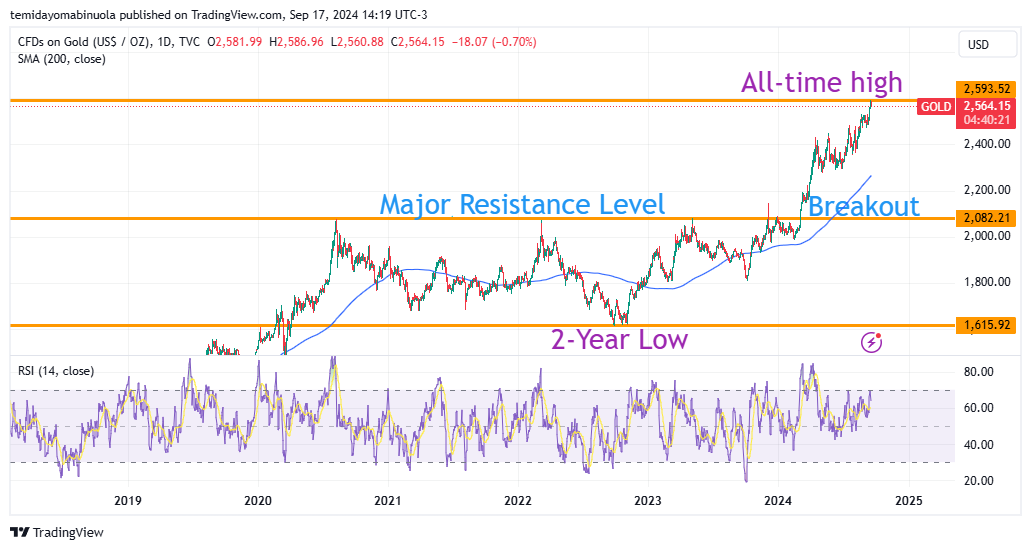
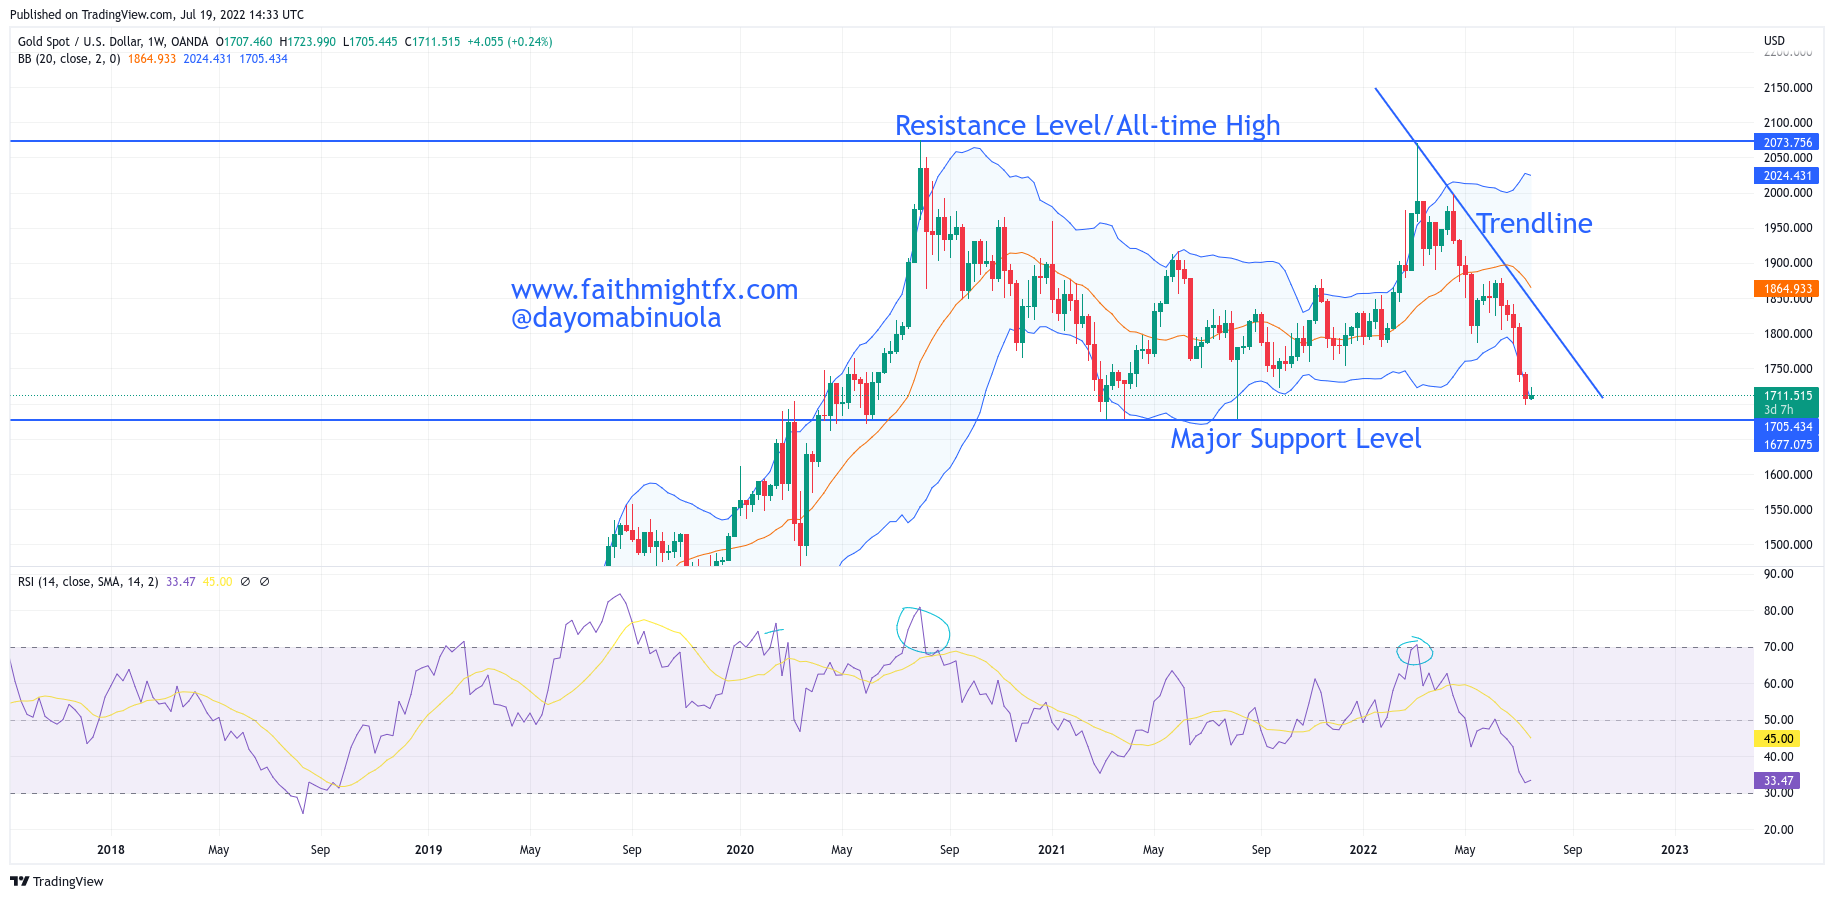
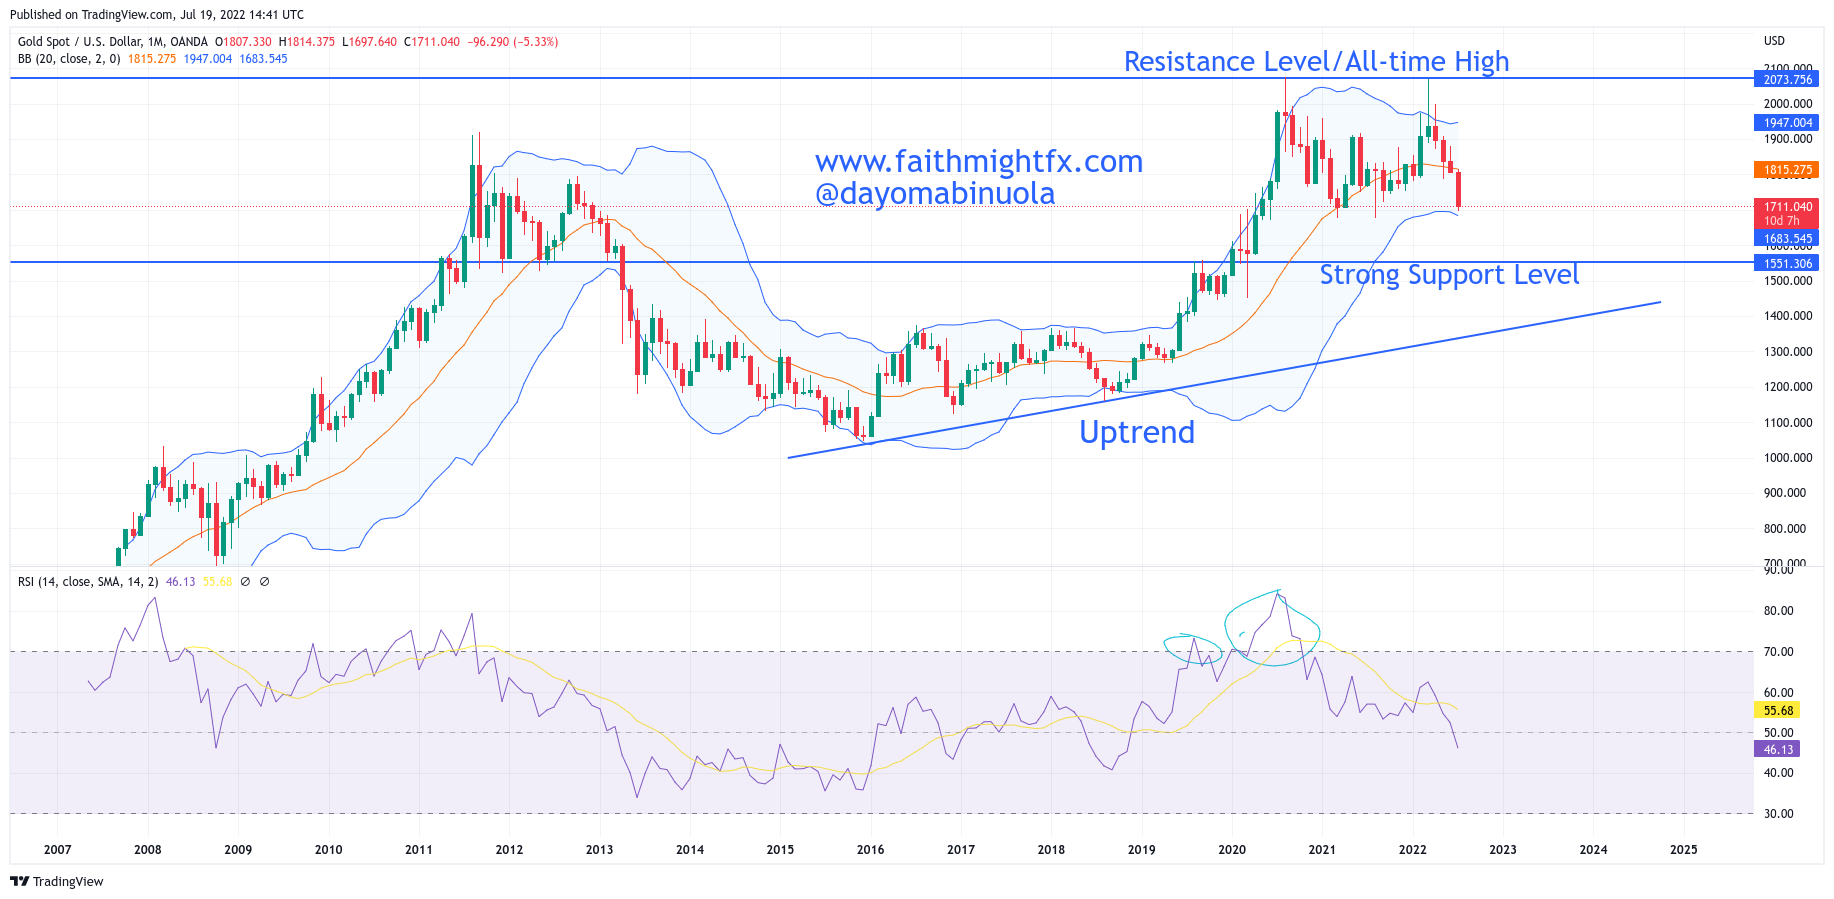
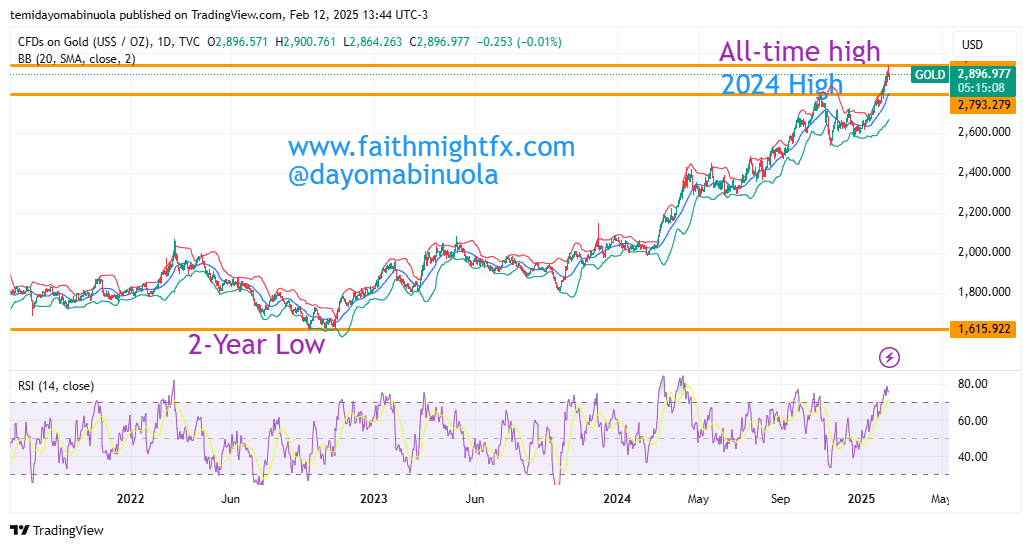
As of February 12, 2025, gold prices have experienced a slight decline from their recent record highs. Spot gold is currently trading at approximately $2,885.53 per ounce, down 0.4% from the previous day’s peak of $2,942.70. This decrease follows comments from Federal Reserve Chair Jerome Powell, who indicated that while the economy remains stable, the Fed is not in a hurry to cut interest rates but will consider doing so if inflation decreases or employment weakens. Higher interest rates can diminish gold’s appeal as an investment, as it is a non-yielding asset.
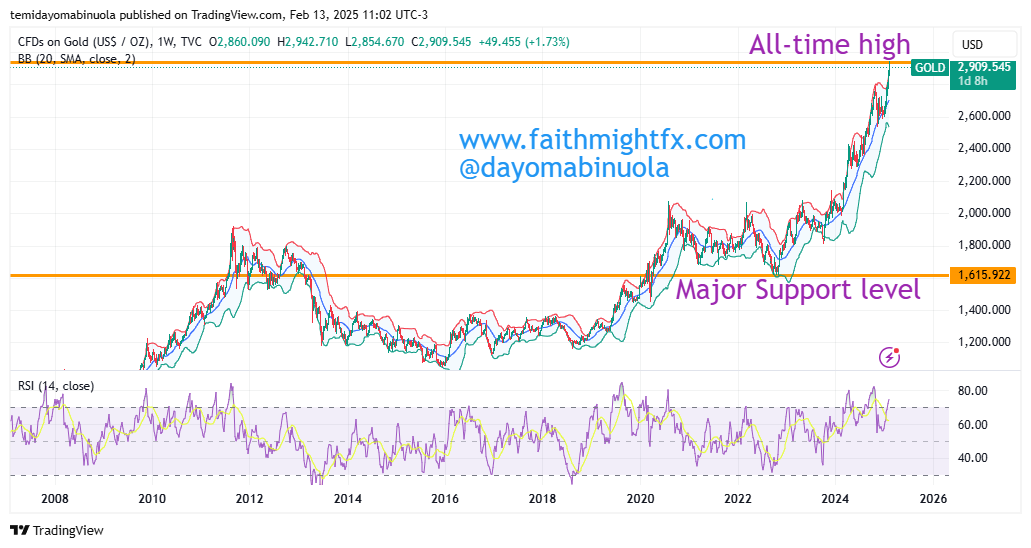
Despite this recent dip, gold has seen a significant surge over the past year, rising by 40% since early 2024 and reaching $2,900 an ounce. This increase is attributed to various factors, including heightened demand from central banks diversifying their reserves amid geopolitical tensions and uncertainties. Notably, central banks have been purchasing gold for 15 consecutive years, with demand escalating in recent years due to geopolitical tensions and macroeconomic factors. The price of Gold might continue to rise, which could eventually reach $3000 psychological level this year.
Some of these ideas are in our clients’ portfolios. To understand if this one can work for you or for help to invest your own wealth, talk to our advisors at FM Capital Group. Would you like more information on how to get commodities in your portfolio? Schedule a meeting with us here