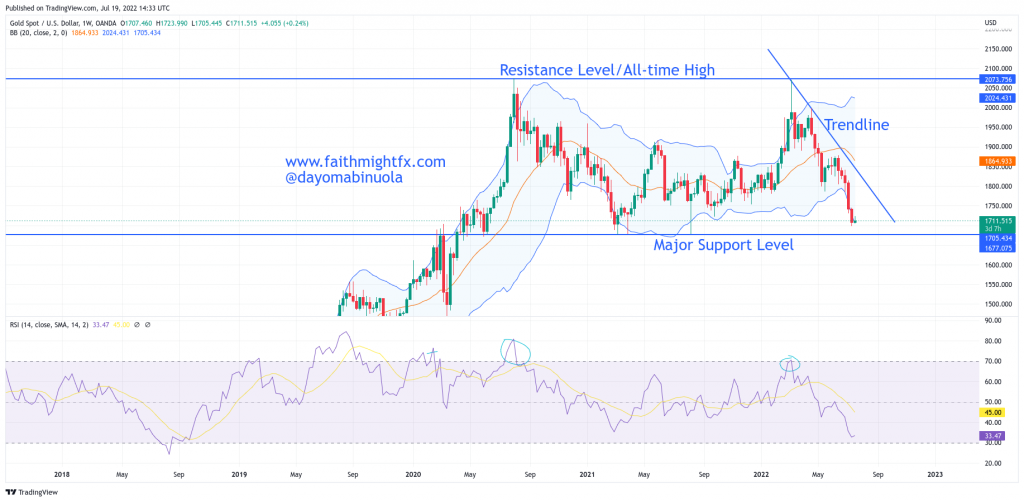
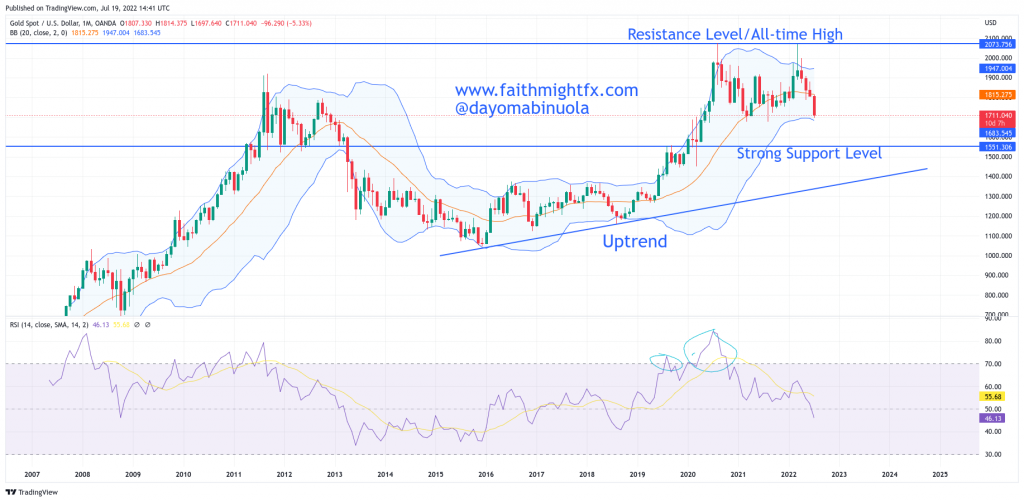
Gold opened in 2022 at $1830 per ounce and for the first part of the month, it was bullish. But then it changed direction and began to fall until it eventually closed on a bearish candlestick at $1796. As February 2022 began, the bulls got their groove back and were dominant for the next couple of weeks which caused February and March 2022 to both close with bullish candlesticks.

Gold price movements in 2021 was more of a range between $1907 and $1705 on the monthly time frame. The range was even more pronounced in the second half of 2021. The highest point Gold reached in 2021 was $1960. Looking at Gold this year, the highest point it has reached is $2067.

On the 23rd of February 2022, we forecasted that Gold may not be able to keep up the bullish rally (see article). We were correct on that call because since March 2022, Gold has been falling. On the bearish run, Gold’s price fell to $1699, which stands as the lowest point this year. In the publication referred to earlier, a support line was drawn at $1676 and our analysts believe that with the current bearish force on Gold, that support level could be broken to the downside.
Some of these ideas are in our clients’ portfolios. To understand if this one can work for you or for help to invest your own wealth, talk to our advisors at FM Capital Group. Would you like more information on how to get commodities in your portfolio? Schedule a meeting with us here

