Since Bitcoin was launched in 2009, price has maintained a strong bullish movement with about 410,000% gain, from $0.09 in 2009 to its current price at $36,700. The current $BTC market capitalization stands at $678Billion. Ethereum, on the other hand, is the second largest crypto with current market capitalization at $299Billion after its launch in 2015.
This signifies that most crypto assets are less than a decade. Ethereum has since its inception has been publicly accepted by Crypto traders and investors. Hence, the reason for the bullish movement. Just like other markets, the crypto market is a bull and bear market. High leverage usage must have wiped off some accounts due to greed. Currently, the crypto market is about $1.62Trillion with Bitcoin and Ethereum having over 61% of the market share. There are other thousands of cryptos newly introduced e.g. Ripple, Dash, Tether, Litecoin, Cardano etc. all of these make up the remaining 39% share of the crypto market.
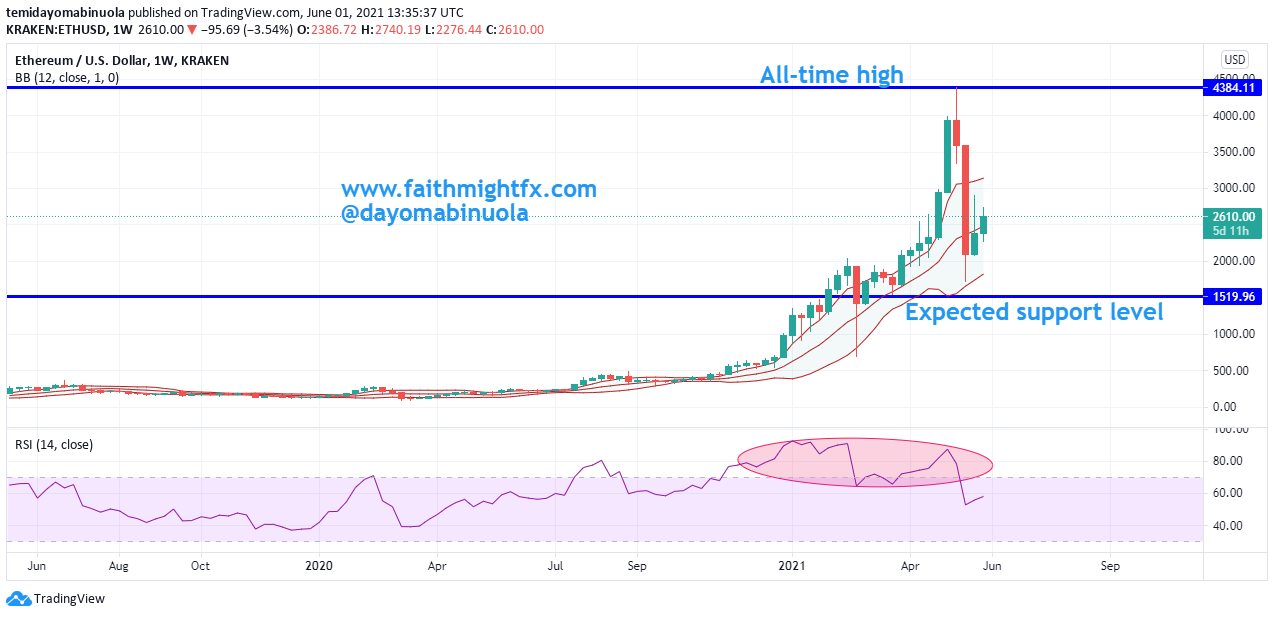
Bitcoin, in June 2020, was below $10,000. As at today, Bitcoin is above $36,000. Ethereum in June 2020 was below $300, the price of Ethereum today stands at $2,600. In the last one year, Ethereum has done far better than Bitcoin in investment gains. Both Bitcoin and Ethereum reached an all-time high in 2021. Ethereum reached $4,370 in may 2021 and Bitcoin reached $63,000 in March 2021. With Bitcoin and Ethereum having 61% of the total crypto market, they both have a major influence in the price movement of other coins. The increased acceptability of Bitcoin and Ethereum will determine the acceptability of other coins.
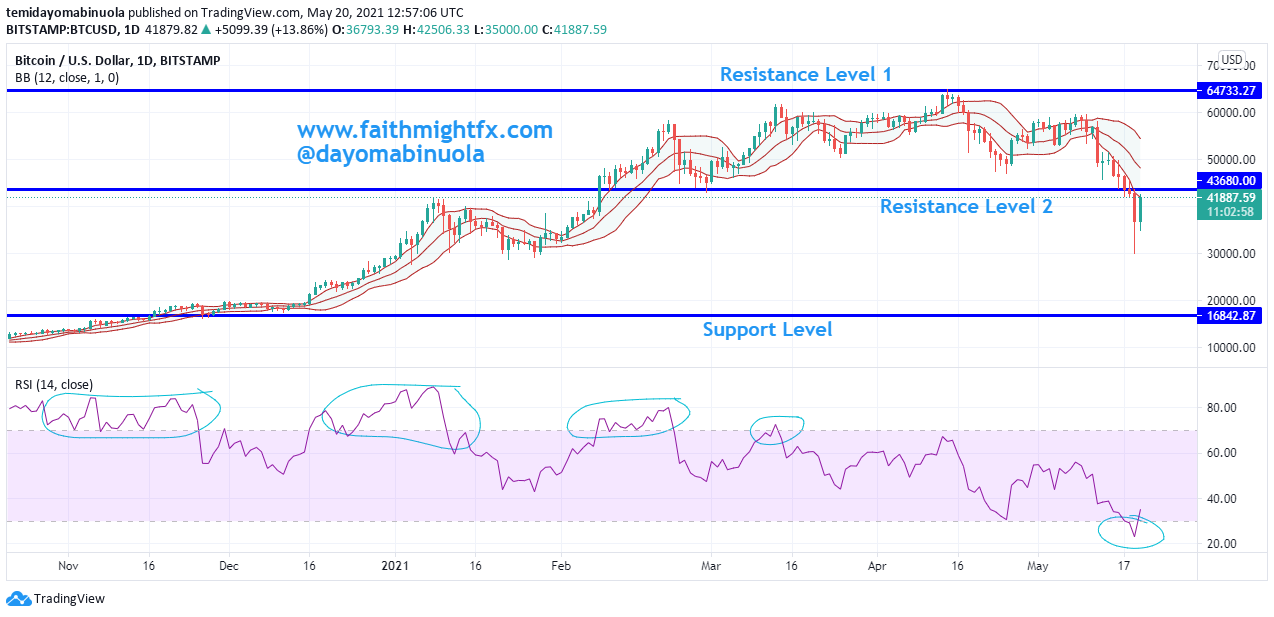
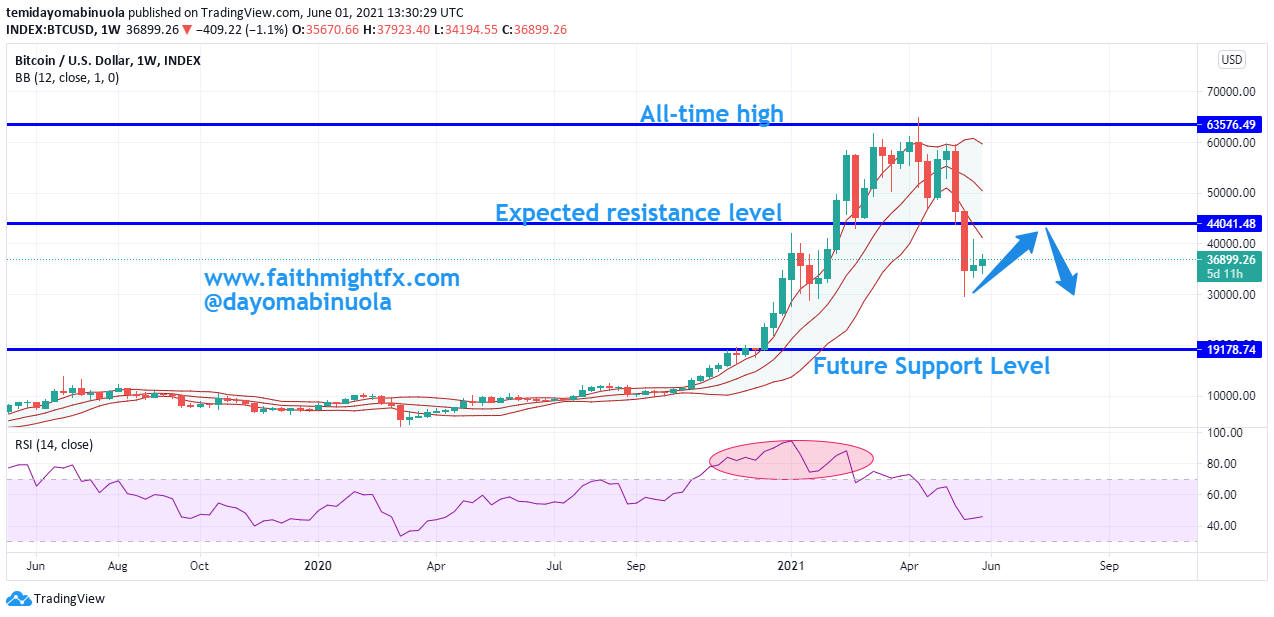
After the all time high was reached in March 2021 at $63,000, price was almost halved after it reached $31,200.
About $30,000 was wiped out in the price of Bitcoin last month, which made it the worst month in Bitcoin history with 41% lost from the highest price. Bitcoin has a very strong resistance at $43,980, a bullish breakout from this level might result in a fake out as price on the weekly chart is currently in the lower region of the Bollinger bands. The recent dip affected most of the assets in the Crypto market. Price of $BTC might rally towards $44,000, but the bears might push the price lower to reach $19,000. If a dip occurs, this will reflect in the prices of other cryptos. The next dip might also push price of Ethereum to $1,500.