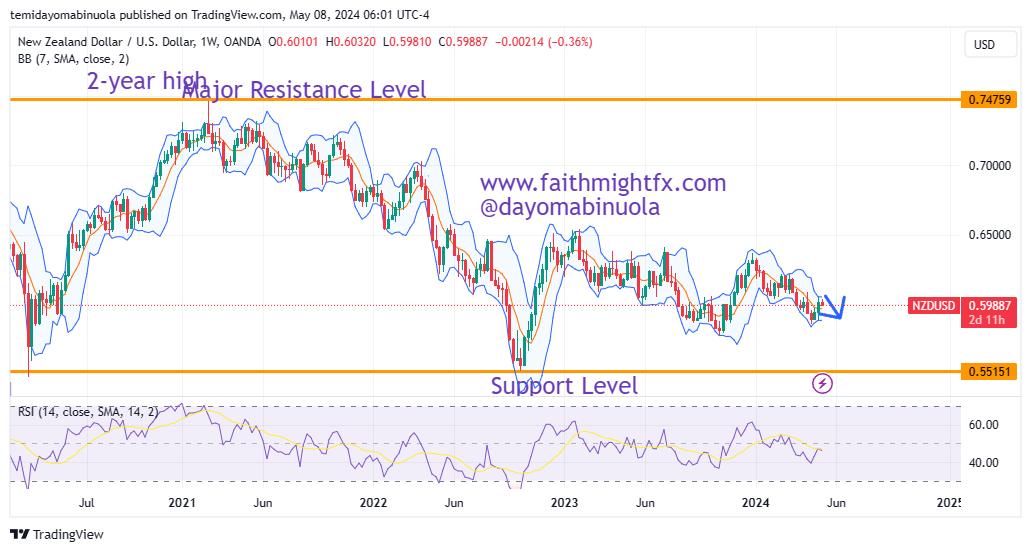
The kiwi has not been doing so well since the beginning of the year. The opening price of NZDUSD in 2024 was 0.63293, and the lowest price this year is 0.58503, in April 2024. The Kiwi’s downtrend had begun in February 2021 at a major resistance level at 0.74759. On the weekly chart, a hammer has been formed at the support level at 0.58503, which has led to a rally from the week of April 15. The current price of the kiwi is at 0.59821.
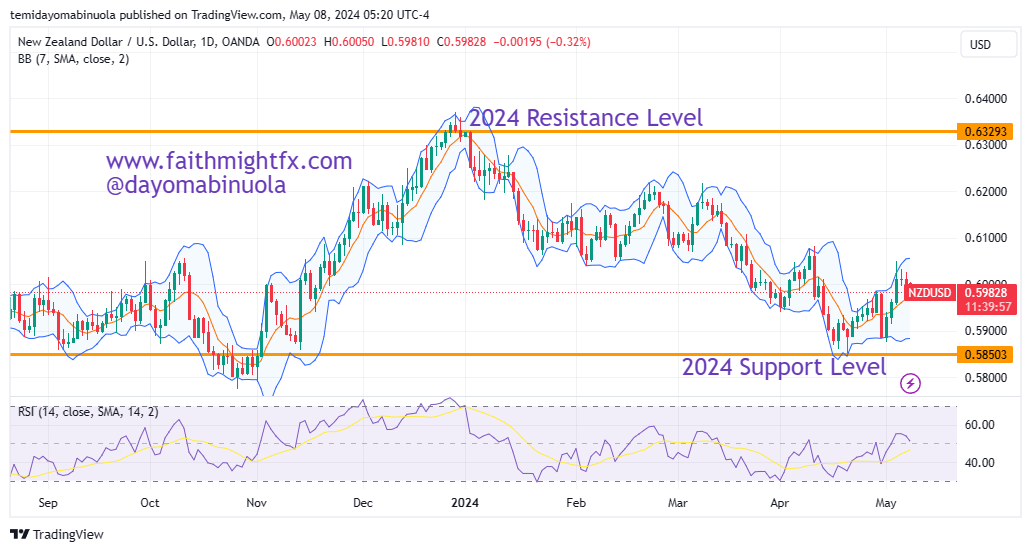
The correction in the price of the kiwi has made price rally to the recent high at 0.60495. The USD is beginning to gain against the NZD. Since February 2023 until now, the price of Kiwi has been moving between 0.57784 at the support level to the resistance level at 0.64218. We might see the price of the kiwi fall to 0.59080 in the coming days, as the bulls are beginning to lose momentum.
Some of these ideas are in our clients’ portfolios. To understand if this one can work for you or for help to invest your own wealth, talk to our advisors at FM Capital Group. Would you like more information on how to get currency in your portfolio? Schedule a meeting with us here