fbpx

Nvidia Rallies To Previous Resistance Level

NVIDIA rallies to previous Resistance level

NVIDIA is an American multinational technology company based in California, USA. The company designs graphics processing units. It was founded on the 5th of April, 1993 by Jensen Huang, Curtis Priem, Chris Malachowsky. As of 2022, NVIDIA made a yearly revenue of $26.91 billion. As of that same year, NVIDIA had a staff strength of 22,473.

Daily Chart

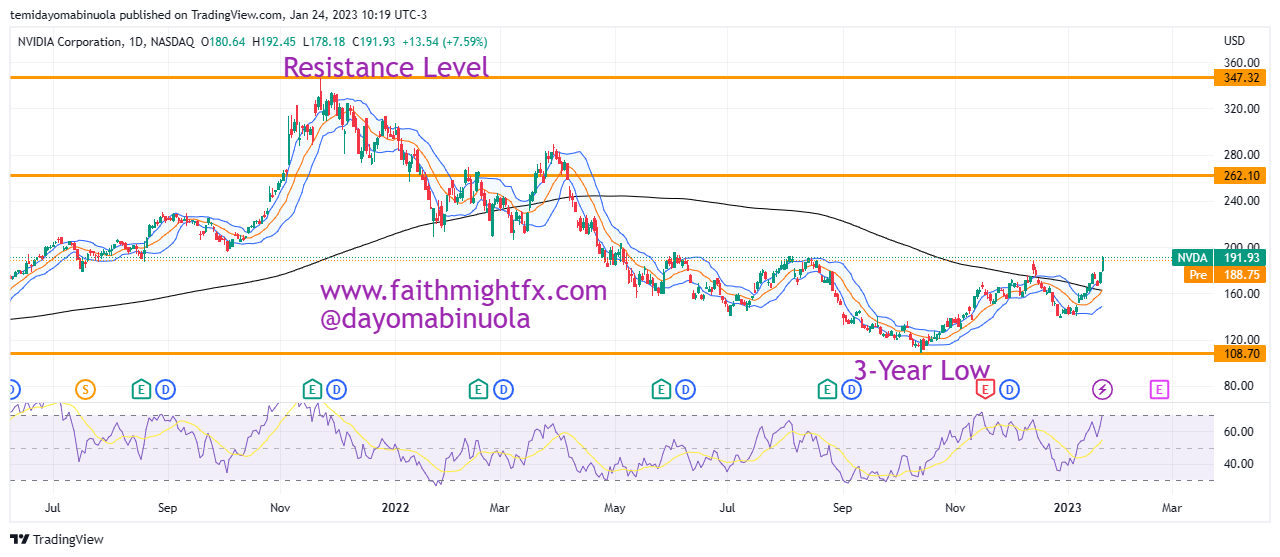
The lowest value of NVIDIA since August 2020 stands at 108.70, which also stands as the support level of 2022. The year 2022 was not a good year for NVIDIA investors as price opened at $298.12 and closed at $146.03 – a 39% loss. There seems to be relief as price began to rally after a bounce from support in the last quarter of 2022.  2023 opened at $147 and price has rallied to $191.93, a 30.5% increase in about a month. The last time price of $NVDA was at $191.93 was in August 2022, which was the previous resistance level.

Weekly Chart

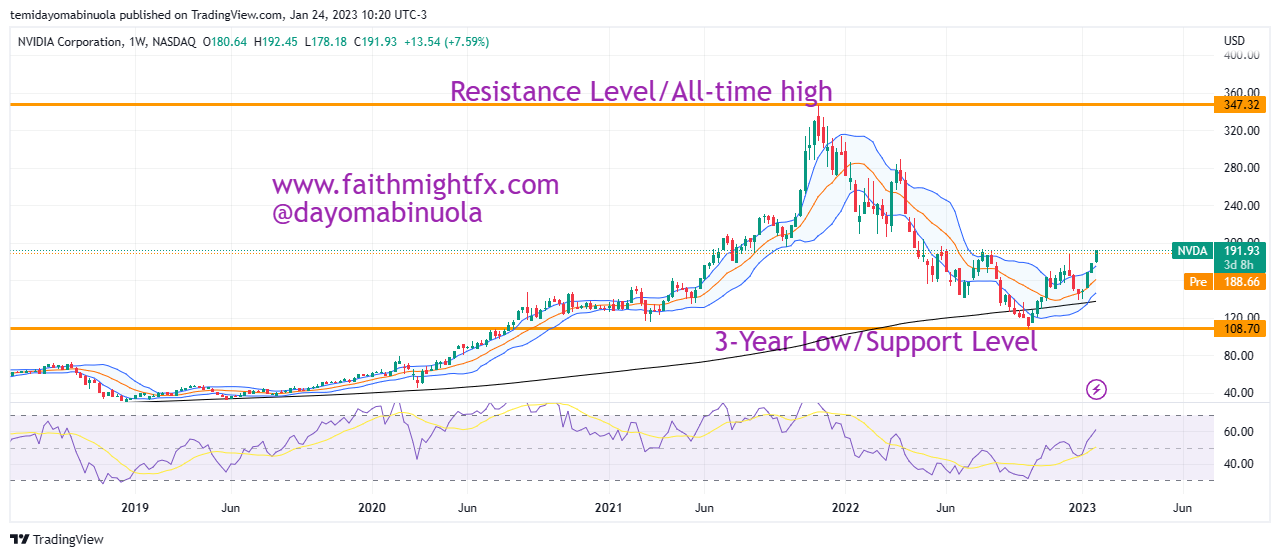
We might be seeing the price of $NVDA reaching $200 per share in the coming weeks.

Some of these ideas are in our clients’ portfolios. To understand if this one can work for you or for help to invest your own wealth, talk to our advisors at FM Capital Group. Would you like more information on how to get stocks in your portfolio? Schedule a meeting with us here

Prometheus Biosciences: The Stock That Rose 165% In 24 hours

Prometheus Biosciences: The Stock that rose 165% in 24 hours

Prometheus Biosciences is an innovative biotech firm aiming to develop novel therapeutic and companion diagnostic product candidates for the treatment of immune-mediated diseases.

Prometheus ($RXDX on NASDAQ) had its IPO on March 12, 2021, at $25 per share. $RXDX has a market cap of $2.01Billion and generates $3.13Million in revenue annually. On Wednesday, the 7th of December, the company released a result of treatment in the development for ulcerative colitis (UC) and Crohn’s disease (CD). The result from this study showed it was effective as a treatment and safe for use.

Weekly Chart

On the 6th of December, $RXDX closed at $35.32 per share. By the opening of the following trading day, there was a gap up as a result of the release of the aforementioned report. This gap up made price open at $105.20 which was over 200% appreciation of the stock as of the time price opened on the 7th of December.

Daily Chart

That same day, price kept rallying to about $112 before it reversed. At the end of the trading day, price closed at $95.80. We might be seeing a price fall to $64 in the coming weeks. In September, RSI indicated price was overbought on the weekly time frame. Right now, RSI is also indicating on the weekly time frame that price is overbought due to this recent rally.

Some of these ideas are in our clients’ portfolios. To understand if this one can work for you or for help to invest your own wealth, talk to our advisors at FM Capital Group. Would you like more information on how to get stocks in your portfolio? Schedule a meeting with us here

Are Udemy Investors Caught In A Bear Trap?

Are Udemy investors caught in a Bear Trap?

Udemy is a massive American open online course provider. It was founded in 2010 and by April 2021, the platform had recorded more than 40million students, 155,000 courses and 70,000 instructors in over 65 languages. As of 2022, Udemy has over 52milion users. Between 2011 and 2020, Udemy made some series of fund raising. The last funding before the IPO in 2021 was for $50million at $3.2billion valuation led by Tencent Holdings.

Weekly Chart

On October 29, 2021, Udemy held their IPO with a price of $27 per share. Price of $UDMY rallied only for a few weeks from its IPO to reach an all-time high at $32.68 on the 19th of November 2021. The next trading day after the all-time high was reached, the bears took full control and price began to dip and closed below the IPO price even before the end of November 2021.

Monthly Chart

The opening price of this year was at $19.51. as price, it has also been a year of low volatility, though the first four months closed bearish. The price of $UDMY in 2022 has been between $19.84 in January, which is the highest price level in the year and  $9.47 in July, which also stands as the all-time low. Udemy share price right now is at $14.24 and we might be seeing a price fall to $11.79 in the coming weeks.

Some of these ideas are in our clients’ portfolios. To understand if this one can work for you or for help to invest your own wealth, talk to our advisors at FM Capital Group. Would you like more information on how to get stocks in your portfolio? Schedule a meeting with us here

Robinhood Share Price Falls, To Reach A New All-Time Low

Robinhood share price falls, to reach a new all-time low

Robinhood Markets, Inc. is an American financial services company, with her headquarters in California. It’s a FINRA-regulated broker-dealer, registered with the U.S. Securities and Exchange Commission. As of March 2022, Robinhood had 22.8million funded accounts and 15.9million monthly active users. In April 2022, Robinhood introduced a cryptocurrency wallet to more than 2 million users.

Weekly Chart

Most Robinhood investors would be in losses, except for those investors with new entries from June 2022. Robinhood had its IPO at $37.87 in July 29, 2021. The stock rallied for just few days, as price eventually reached an all-time high at $85.15 on the 4th of July, 2022. Since its IPO, only the first five trading days were in favor of the $HOOD bulls. Since November 17, 2021, Robinhood has been trading below the IPO price at $37.87.  

Daily Chart

2022 has been a bearish year for $HOOD investors. The current price of $HOOD shares is at $9.74. The all-time low for Robinhood is at $6.71, which was hit in June 2022. Recently, the crypto industry witnessed another crash. We might be seeing another drop in the price of $HOOD, which could eventually make the price reach a new all-time low below $6.71. We might be seeing price reach $6 or $5 per share.

Some of these ideas are in our clients’ portfolios. To understand if this one can work for you or for help to invest your own wealth, talk to our advisors at FM Capital Group. Would you like more information on how to get stocks in your portfolio? Schedule a meeting with

Airbnb Price Bounces From All-Time Low

AirBnB had its IPO in December 2020 at $145 per share. This IPO was done a few months after the ease of lockdown globally. Price rallied to $219, an all-time high, on February 11 2021. The rally was short-lived as price fell to $129.49 in May 2022, which was below the IPO price. There is a report that indicates that travel around the world is starting to slow because of high energy prices, and consumers are having a second thought before going on vacation. The housing market is currently in turmoil, which could spill over to the AirBnB market.

Monthly Chart

Since the beginning of the year, AirBnB has been down by 32.46%. As a result of the fall, price crossed the $100 psychological level for the first time as it hit $85 in July 2022. Price is consolidating on the weekly chart, as the price of $ABNB is currently at $110.30. A rally to $196 might occur in the coming months.

Daily Chart

Some of these ideas are in our clients’ portfolios. To understand if this one can work for you or for help to invest your own wealth, talk to our advisors at FM Capital Group. Would you like more information on how to get stocks in your portfolio? Schedule a meeting with us here

New Entry Point for Potential Investors In Alphabet Inc. Stock

The downward price movement has not been favorable to Alphabet investors since the beginning of this year. Potential Alphabet investors must be looking out for best entry points, but the price keeps moving around the year’s support level at $95.25. The opening price of Alphabet at the beginning of this year was at $144.54, with the first month of the year closing bearish. There was a temporary rally in February that made price hit $152.07, making it the year’s high and also the all-time high.

Daily Chart

The price movement since the all-time high was reached has been characterized with lower-highs and lower-lows. The year’s low is currently at $95.58. The market opened today, the 26th of October, and as a result of a gap down, the price is at $96.89, from $104.93 where it closed yesterday. The gap down might be closed in the coming weeks as price rallies to reach $100. If Price eventually reaches $100, this might be a good entry point for potential investors in Alphabet Inc. as price makes its way to $138.

Weekly Chart

Some of these ideas are in our clients’ portfolios. To understand if this one can work for you or for help to invest your own wealth, talk to our advisors at FM Capital Group. Would you like more information on how to get stocks in your portfolio? Schedule a meeting with us here

This Company Made 77% This Week, Karuna Therapeutics

Karuna Pharmaceuticals is a clinical-stage biopharmaceutical company focused on developing novel therapies to address disabling neuropsychiatric conditions. It specializes in research, development, commercialization of numerous central neural system agents and products targeted at a broad range of psychiatric and neurological conditions. The biotech, Karuna Therapeutics released its 2022 second quarter results yesterday, apart from this news, the karuna’s experimental psych medication, The share price appreciated 77% yesterday.  The yesterday’s rally led to Karuna Therapeutics reach an all-time high at $245.00.

Weekly Chart

$KRTX had its IPO at $17.95 on the June 19, 2021. The price fell to a new low in October 2019 at $10.75. The previous all-time before the rally yesterday was at $162.00 which was in November 2021. There was a gap-up yesterday which led to the all-time high at $245.00. On the weekly chart, the RSI is already is already overbought. There could be a reversal from the all-time in the coming days. The price of $KRTX could fall below $200.

Daily Chart

Some of these ideas are in our clients’ portfolios. To understand if this one can work for you or for help to invest your own wealth, talk to our advisors at FM Capital Group. Would you like more information on how to get stocks in your portfolio? Schedule a meeting with us here

Hertz Share Price Jumps

Hertz Share Price jumps

Hertz Corporation is a subsidiary of Hertz Global Holdings, Inc. Hertz is an American car rental company based in Florida. The company operates approximately 12,000 corporate and franchisee locations, both domestically and internationally. Since Hertz had its IPO in October 2020, it has been a jolly ride for its investors. Price at IPO was at $1.20. At the time of IPO, global companies were gradually resuming operations post lockdown. There was a range in price from October 2020 to May 2021 where price moved between $0.43 and $2.69. After the breakout in price in May 2021, there has been a phenomenal increase in the price of Hertz. In November 2021, price reached $46.02, which stands at the all-time high.

RSI has shown on the weekly chart that price has been overbought since May 2021. Despite this indication, price rallied to the all-time high. The year’s opening price was at $25.96. The year’s current low is $15.33 which was hit in February 2022. The Hertz shares have not been doing so well this year because of the price ranging between $14 and $26.02. A gap-up occurred yesterday which made price reach the $20 psychological level yesterday. This could be a huge relief for investors in 2022. This rally might continue as price could hit $24 in the coming weeks.

Some of these ideas are in our clients’ portfolios. To understand if this one can work for you or for help to invest your own wealth, talk to our advisors at FM Capital Group. Would you like more information on how to get stocks in your portfolio? Schedule a meeting with us here

Kidney Dialysis Firm, Davita, Loses 2022 Gains

Davita is a US healthcare service provider with a focus on kidney dialysis services. Davita has over 2800 outpatient dialysis centers in the United States which serves over 200,000 patients. They also have 321 outpatient dialysis centers in 10 other countries serving 3200 patients.

Monthly Chart

Davita was founded in 1979 and it got listed on the New York Stock Exchange in 1995 at $3.50 IPO price. Price rallied for a few years after the IPO but in the year 2000, price fell to $0.72 per share which is Davita’s worst share price ever since it launched on the NYSE. Since then, Davita’s share price has rallied to an all-time high at $136.62 in August 2021. This is over 100X of the lowest ever price. 

When price reached an all-time high, RSI also showed that price had been overbought on the monthly time frame. Price fell shortly afterwards to $94.34 in November 2021. The opening price of Davita at the start of the year 2022 was $114.10. Price rallied to the current year’s high at $124.85. However, the bears are back in action as Davita’s share price closed below $100 at the end of May.

Daily Chart

As price consolidates in the next few weeks, we might be seeing a price rally above $100. Our analysts are seeing the price of Davita rise to $120 in the coming months. The recent news of Davita’s partnership with Medtronic to form a new kidney tech company worth about $200million could also trigger a rally from a fundamental analysis standpoint. We’ll see!

Some of these ideas are in our clients’ portfolios. To understand if this one can work for you or for help to invest your own wealth, talk to our advisors at FM Capital Group. Would you like more information on how to get stocks in your portfolio? Schedule a meeting with us here

Sunrun Rallies After Hitting Lowest Point Of The Year

Sunrun is an American provider of residential solar panels and home batteries out of San Francisco, California. It was founded in 2007. The firm was able to raise $12million in venture capital funding in June 2008. In 2009, Sunrun closed a Series B funding of $18million. They have had other sources of funds after the Series B.

In 2015, Sunrun went public on NASDAQ at $14 per share with an initial market cap of $1.36billion. Sunrun’s annual revenue as of 2020 was $92million. The lowest point Sunrun’s share price was in the year 2020 was at $7.83. This happened in March 2020. The price dropped to this lowest point from $23.58, where it was just a month before that i.e. February 2020. This was about a 67% loss in its value.

Weekly Chart

Price jumped dramatically from the then-lowest price of $7.83 in March 2020 to the 2020 high of $82.67 in September 2020. This is about 11X of the lowest price in just 6 months. After this extraordinary rally, the price closed at the end of 2020 at $69.39. There was a temporary rally in 2021 as the price of Sunrun in January 2021 hit $100 for the first time in its history-making it an all-time high. 

Daily Chart

Ever since this threshold was reached, Sunrun has been on a losing streak. The lowest price of Sunrun this year was reached in the second week of May 2022 at $16.82. Price, however, has been consolidating since mid-April on the weekly chart, and it rallied up from the lowest price to $26 where it currently is. We might be seeing the rally continuing and the price reaching $40 and even more in the coming months.

Some of these ideas are in our clients’ portfolios. To understand if this one can work for you or for help to invest your own wealth, talk to our advisors at FM Capital Group. Would you like more information on how to get stocks in your portfolio? Schedule a meeting with us here