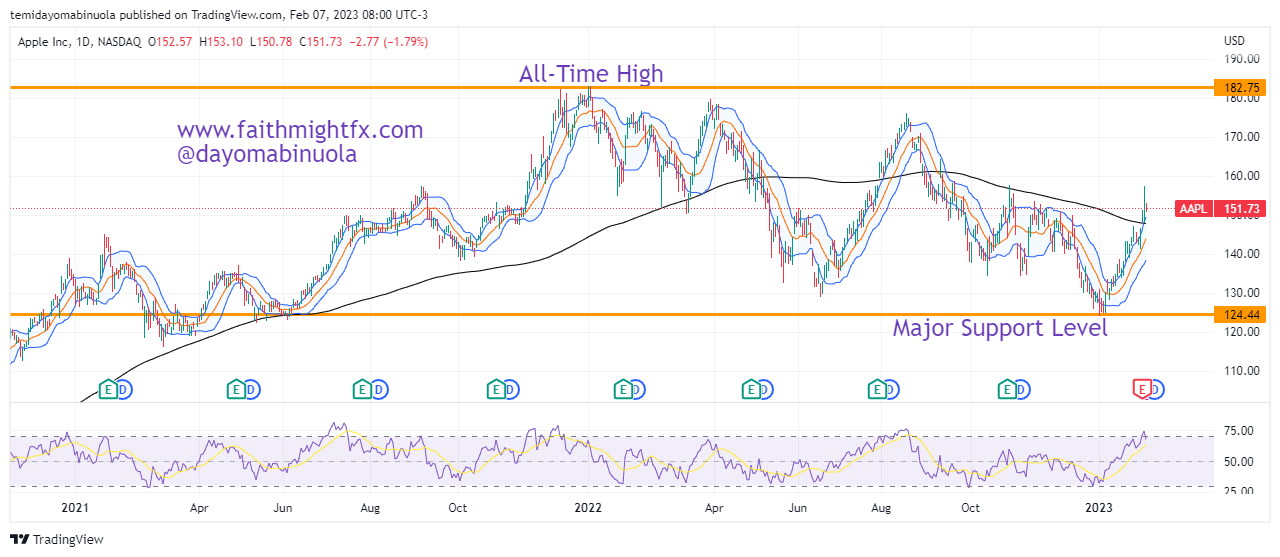
Nvidia was founded in 1993 by Jensen Huang, Chris Malachowsky, and Curtis Priem with a vision to revolutionize visual computing. It initially focused on graphics processing units (GPUs) for gaming and multimedia applications. In 2025, Nvidia’s market capitalization surpassed $3 trillion, positioning it as the second most valuable company in the World.
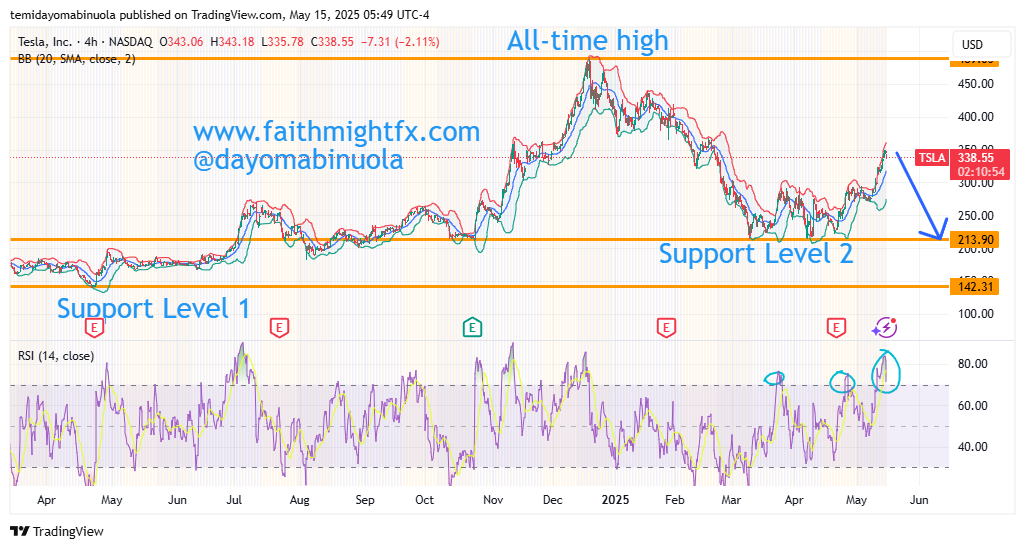
Nvidia’s stock surged due to a May 13, 2025, majorly due to partnership with Saudi Arabia’s Humain (AI company), backed by the sovereign wealth fund, to supply 18,000 GB300 chips for a 500-megawatt AI data center, scalable to 1.9 gigawatts by 2030. Additionally, Nvidia may sell up to 500,000 chips yearly to the UAE through 2027, following eased AI restrictions. These Middle East deals counter U.S. sanctions limiting chip sales to China (17% of 2024 revenue). Between January 2015 and January 2025, Nvidia’s stock appreciated by approximately 28,440%. Since its IPO in 1999 to May 2025, the return is over 300,000%.
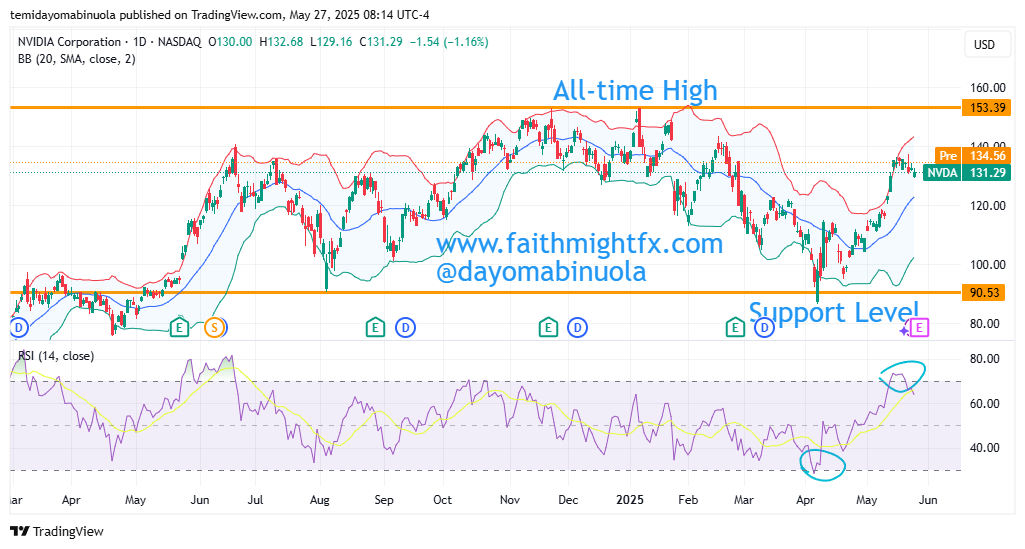
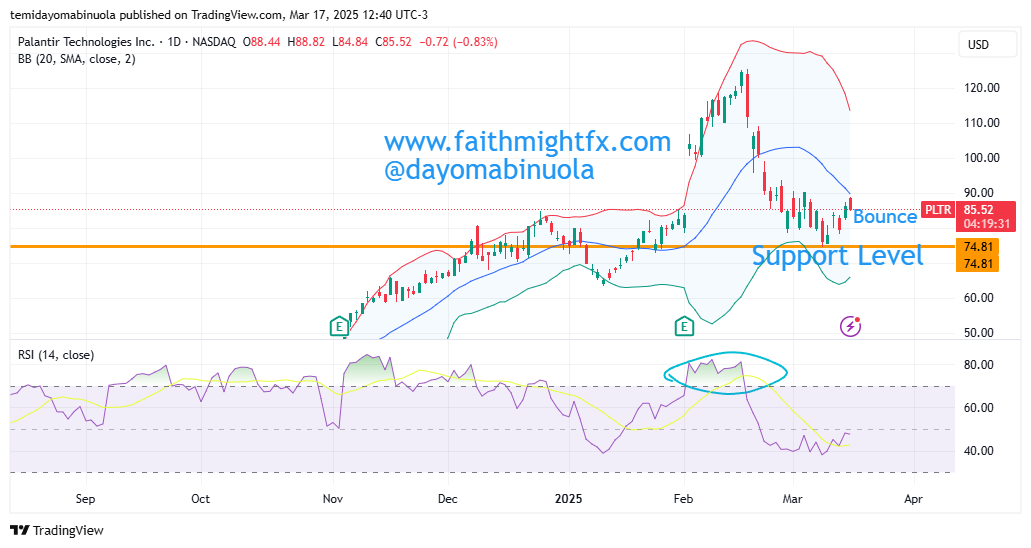
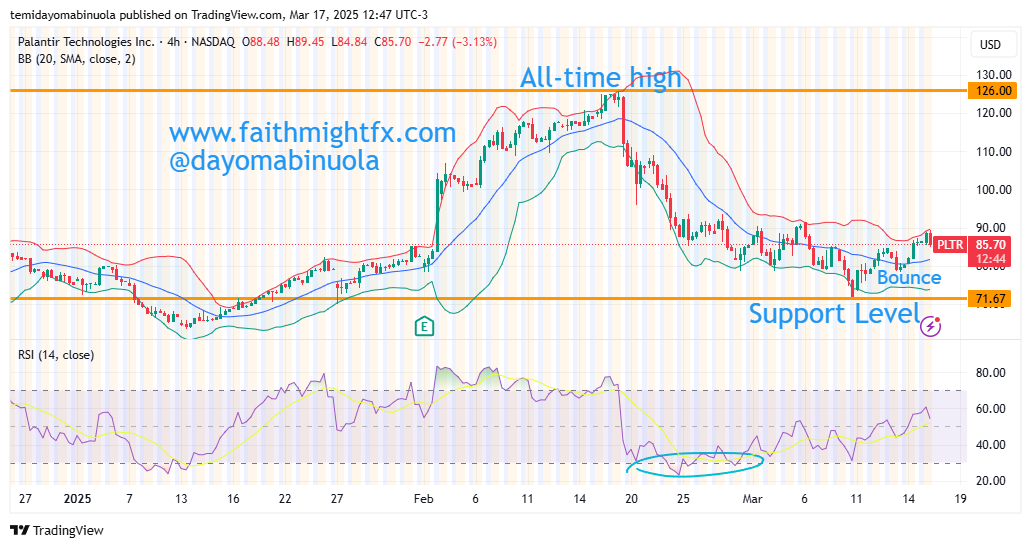
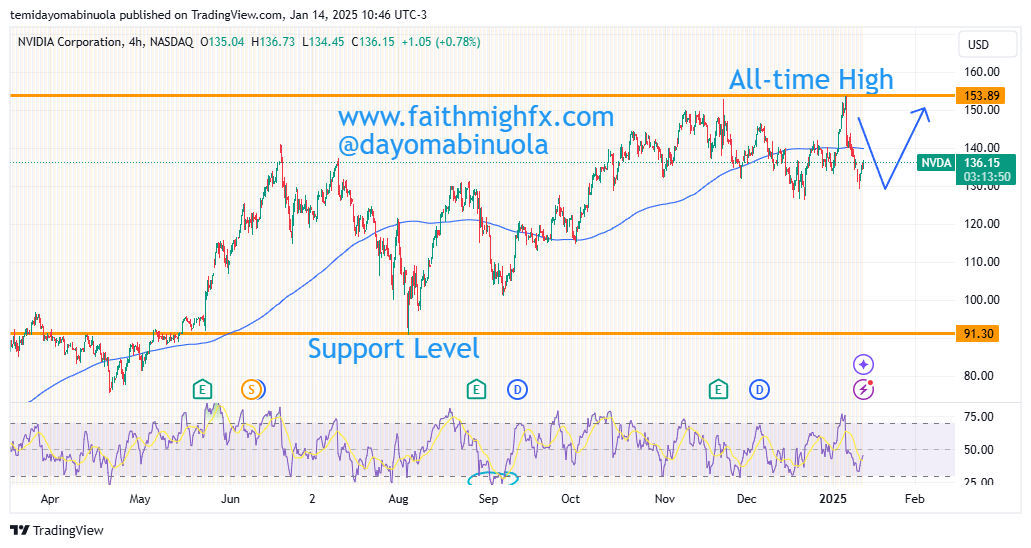
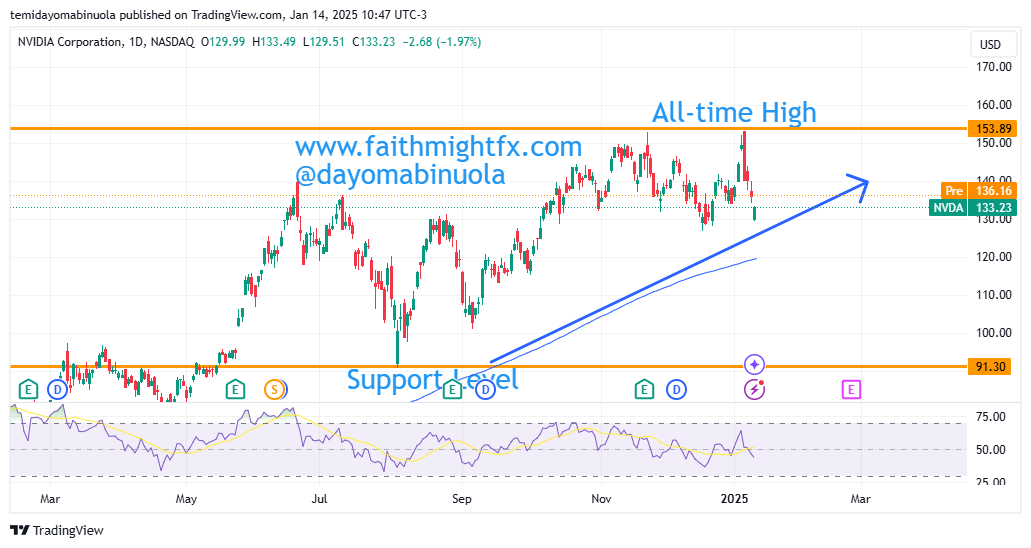
Nvidia’s stock faced setbacks in early 2025, including a $600 billion loss in market cap due to competition fears and a 9% dip after Q4 earnings. However, it rebounded strongly, rising 50% from April lows, driven by positive technical signals like a bounce from the support level at $90.53. Year- to-date, Nvidia has done 172% as of May 2025.
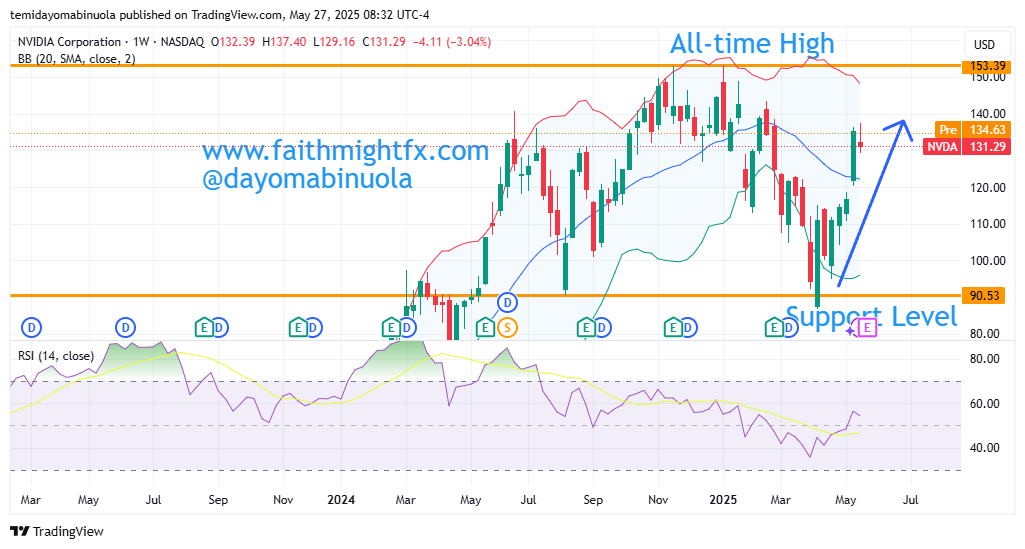
The price of Nvidia could rally to $152 from the current price at $131.29 in the coming weeks despite price is being overbought on the RSI both on daily and weekly charts.
Some of these ideas are in our clients’ portfolios. To understand if this one can work for you or for help to invest your own wealth, talk to our advisors at FM Capital Group. Would you like more information on how to get stock in your portfolio? Schedule a meeting with us here