fbpx

Etsy Share Price Consolidates

American e-commerce company, Etsy, began to suffer a big loss in share price after an all-time high was reached at $307.57 on December 26, 2021. $ETSY has lost about $200 since its all-time high last year December.  The bears have been more active since the beginning of the year 2022. Etsy opened the year 2022 at $222 but has since lost about $100, leaving it at $124.28 as at April 1, 2022. 

Weekly Chart

In the past 5 months, there have been several indications of the price being oversold on the Etsy 4hr Chart . Etsy’s previous support level on the weekly chart was maintained at $155.15 since May 2021. The recent downward slide this year has made Etsy reach a new support level at $108.95 as of February 24, 2022. The next bull run for Etsy might make the price reach $278, which is over $105 gain from its current price. In a situation where the bulls continue to push prices higher than $278, a new all-time might be reached. As price consolidates, a breakout to the upside above $164, could be the clue for the next bull run.

4hr Chart

Some of these ideas are in our clients’ portfolios. To understand if this one can work for you or for help to invest your own wealth, talk to our advisors at FM Capital Group. Would you like more information on how to get stocks in your portfolio? Schedule a meeting with us here.

Airbnb Maintains $140 Support Level

On December 10, 2020, Airbnb went public with an IPO price of $146 per share. For the first two months after the IPO, the bulls were in action, rallying the price to an all-time high of $219 per share in February 2021. Following this all-time high was a price slump, with the price closing in May 2021 at $140, a price below the IPO. For the next three months after the price closed below the IPO price, the price ranged between $130 and $155.

Monthly Chart

In September 2021, the price broke out to the upside which initiated a new price rally that allowed the price soar to $212. Despite the gains accrued in the first quarter of the year 2021, the price closed for the year 2021 at $166. January and February 2022 must have made investors even more worried as the two months closed on a bearish note.

Weekly Chart

March, however, has been comparatively more bullish than the first two months of the year 2022. AirBnB’s share price is currently at $175. From a technical analysis standpoint, if the weekly candlestick closes in the upper region of the Bollinger Bands, we might see a bullish run that will shoot the price above $192 per share.

Some of these ideas are in our clients’ portfolios. To understand if this one can work for you or for help to invest your own wealth, talk to our advisors at FM Capital Group. Would you like more information on how to get stocks in your portfolio? Schedule a meeting with us here.
Apple To Hit A New All-Time High

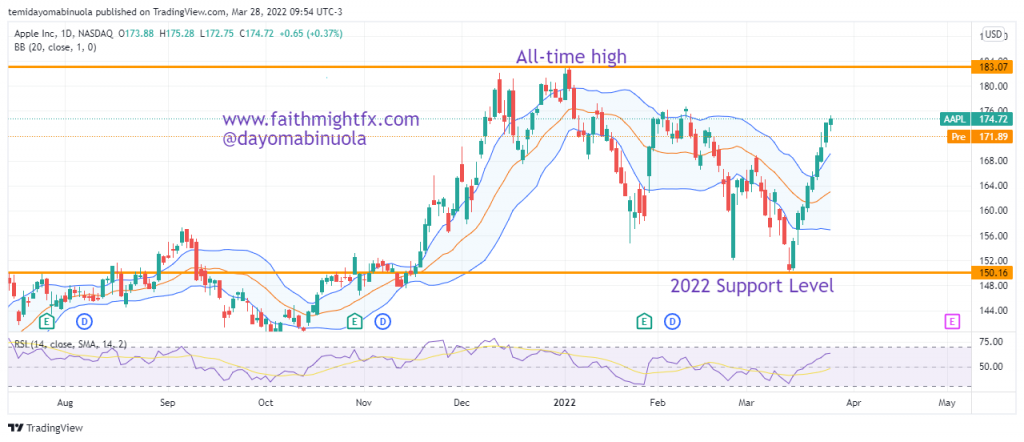
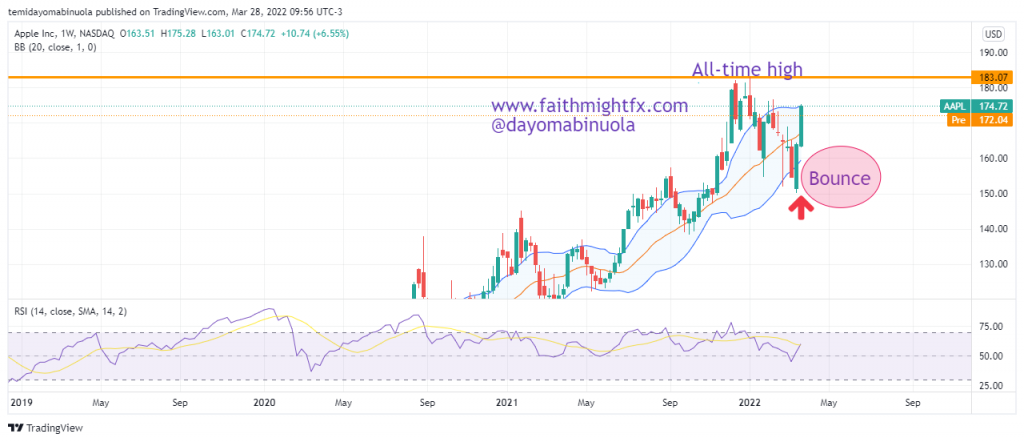
Apple hit a new all-time high of $182.93 on the 4th of January, 2022. Long-term Apple investors were able to benefit substantially from the new all-time high. The rally to the all-time high could not be sustained for long as the price of $AAPL  slumped to a support level at $150.80. This could have been a result of the ongoing war between Russia and Ukraine; or the increase in inflation rate in the US. Over the last decade, $AAPL share price has been on a bullish run with few price corrections. Late into January and the whole of February 2022, there was a correction in Apple’s share price but this dip did not terminate the bullish streak. 


Since mid-March 2022, the $AAPL bulls began to push price higher after an inverted hammer was formed on the 14th of March, 2022. The price of $AAPL closed at $149.66 on the day the inverted hammer was formed. The second and third week of March 2022 have shown that the bulls are about to push the price to a new all-time high in the next quarter. On the week of the 26th of March, $AAPL closed at $174.72, which was over a $25 increase in the price of Apple shares. This recent bullish trend is giving investors confidence in Apple as they hope that the price continues its rally.

Some of these ideas are in our clients’ portfolios. To understand if this one can work for you or for help to invest your own wealth, talk to our advisors at FM Capital Group. Would you like more information on how to get stocks in your portfolio? Schedule a meeting with us here.
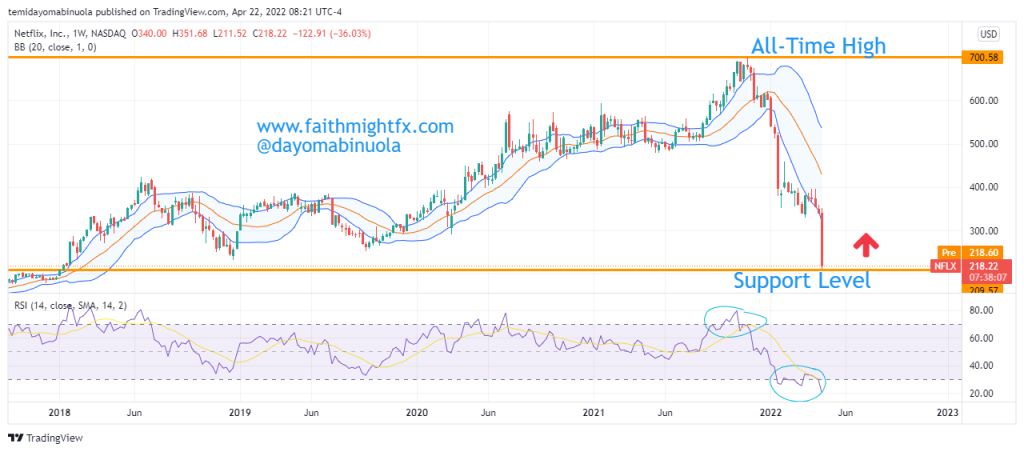
Netflix Share Price Continue To Nosedive

Netflix had its IPO in May 2002 at $1.15 per share. In the first few months of going public, the share price went as low as $0.35. The share price ranged for about seven years with a resistance level of $5.80. The price broke the resistance line in 2009 to reach a new high of $43. From a fundamental analysis standpoint, this breakout was partly due to the positive comments coming from their business model change from DVD to streaming.

Daily Chart

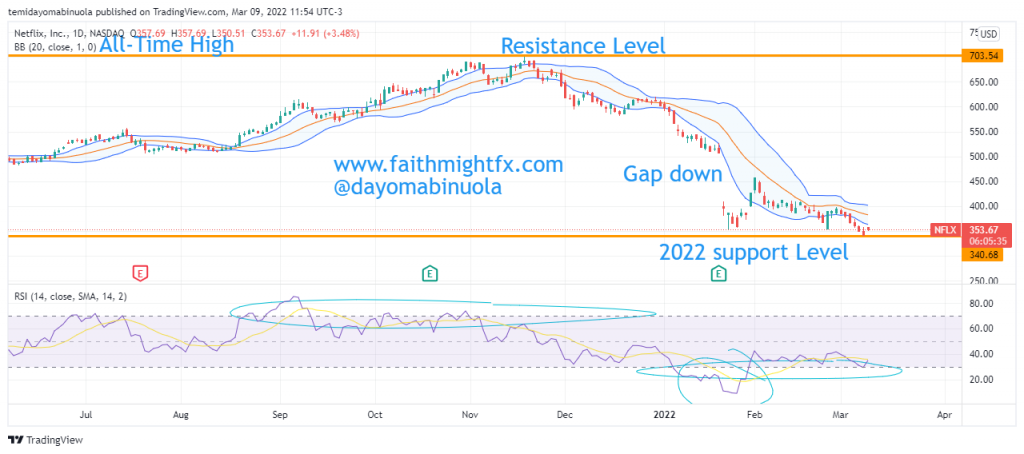
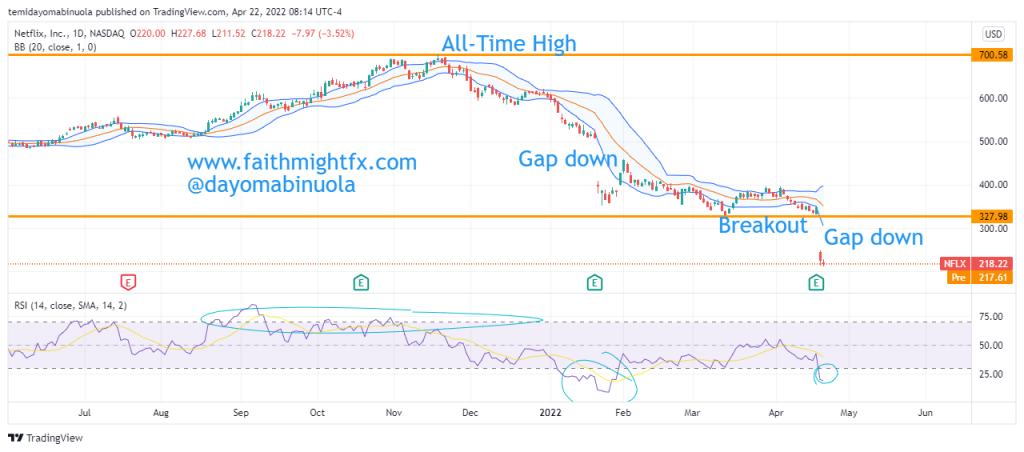
In the latter part of 2011 after the price reached $43, the share price saw a dramatic slump to $8. It dipped even further in 2012 to $7. However, the candlesticks in the last three months of the year 2012 all closed bullish which for the investors, was a silver lining in the dark clouds. As the year 2013 began, this bullish momentum exploded and the price rallied over the years to an all-time high of $700 in November 2021. This bullish trend was a marathon with few corrections that ran for nearly a decade (from 2012 to 2021). Every Netflix investor smiled to the bank during this period.

Weekly Chart

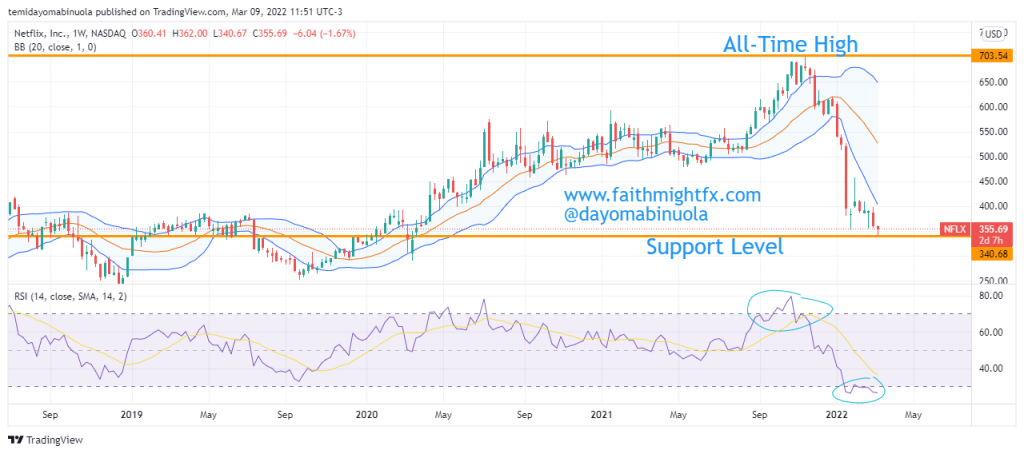
However, since the month of the all-time high in 2021, all candlesticks on the monthly chart have closed bearish. As of March 8, 2022, Netflix had lost more than 50% of its all-time high value. In August 2021, we forecasted a fall in the value of $NFLX to $409. Price fell beyond this expected price level. On the weekly chart, RSI has indicated that the price has been oversold since January 2022. This might be an indication that the price could rally in the coming months from its current value of $341 above $615.

Some of these ideas are in our clients’ portfolios. To understand if this one can work for you or for help to invest your own wealth, talk to our advisors at FM Capital Group. Would you like more information on how to get stocks in your portfolio? Schedule a meeting with us here.
Etsy Dips To A New Low


Etsy is an American Vintage e-commerce company focused on handmade and vintage items and craft supplies. Etsy was founded 16 years ago and went public about 7 years ago at $16. On the day of the IPO, the share price rose by 72%. After 9 months of its launch on the stock exchange, it took a bearish turn and hit an all-time low at $6.04.


From January 2016, $ETSY share price took off in the bullish wave. In November 2021, Etsy’s price reached a new all-time high at $308.96. That high reflected on the RSI as an “overbought” indication. Following that all-time high, the share price fell and so far, the share price has lost 65% of the price of the all-time in November 2021. The most recent price dip did not indicate oversold on the RSI despite the 65% fall in price. The crisis between Russia and Ukraine has not really affected the US stocks as $ETSY has been appreciating from the new low at $108.53 for the past two weeks. This appreciation could lead to a long-term rally that could see $ETSY gaining 100 points.

Some of these ideas are in our clients’ portfolios. To understand if this one can work for you or for help to invest your own wealth, talk to our advisors at FM Capital Group. Would you like more information on how to get stocks and commodities in your portfolio? Schedule a meeting with us here.

Beyond Meat Slumps By 9.2% In The Stock Market

Beyond Meat went public in May 2019 and its IPO price was $45. From the month of the IPO to July 2019, which was under 90 days, Beyond Meat’s share price shot to $240 which became its all-time high. Following the dramatic surge in share price, Beyond Meat lost its momentum and took a downward slope over an 8-month period to $48 in March 2020.

Daily Chart

Despite the share price almost falling back to the IPO price, the bulls were not giving up on Beyond Meat just yet, and so the bulls became active and it led to a rally in price to $220 in January 2021. The bears have been aggressive since then and for 12 months straight, Beyond Meat’s share price has kept falling.

On the 25th of February, Beyond Meat’s share price closed for the first time ever below the IPO price at $44.49. RSI has been oversold since December 2021. Taking into consideration the RSI readings and other technical indications, the bulls might become more aggressive in the coming months and the price may rally above $154 which is about 3X the current price.

Weekly Chart

Some of these ideas are in our clients’ portfolios. To understand if this one can work for you or for help to invest your own wealth, talk to our advisors at FM Capital Group. Would you like more information on how to get stocks and commodities in your portfolio? Schedule a meeting with us here.

Fastly Loses Big 

Fastly is an American cloud computing services provider, which is designed to help developers extend their core cloud infrastructure to the edge of the network, closer to users. The stock had its IPO in the spring of 2019. After surging in its debut and eventually doubling from its IPO price in the early fall, shares went down over 35% from their highs in the fourth quarter, putting many post-IPO investors in the red. $FSLY stock started trading at $21 per share. Fastly said it had sold 11.25 million shares at $21 each, raising $180 million. Fastly investors are back to the initial stage. 

Before the current downturn of Fastly, the IPO investors made over 6x since its IPO. The all-time high of Fastly was in October 2020 at $136.45.  The price of Fastly is currently trading at $20.27, a few points below the IPO price of $21.50. At the beginning of this week, $FSLY opening price was $27.70. Fastly has lost over 27% of its value from the beginning of the week. Until certain measures are taken before $FSLY share price could rally, though a gap-down has occurred which might be filled soon. Since the January 2021 monthly candlestick finished with a bullish one, only June and October monthly candlesticks finished on a bullish note, all other ones have been bearish. 

Some of these ideas are in our clients’ portfolios. To understand if this one can work for you or for help to invest your own wealth, talk to our advisors at FM Capital Group. Would you like more information on how to get stocks in your portfolio? Schedule a meeting with us here.
Lyft Bounces From Support Level


All of Lyft’s profits gained in 2021 were lost before the end of the year. Despite the bullish ride from October to March 2021, the bears overpowered bulls as the share price slumped to $34 from the March 2021 high at $68.  The lowest price for Lyft was at $15 which occurred in March 2020 during the global pandemic. The only time Lyft traded above the IPO price was April 1, 2019, the same day it was listed on the stock exchange. Lyft’s IPO price was $72 valuing the company at $20.5 billion. 

Daily Chart

Lyft investors post IPO have never had a reason to smile to the bank since most part of the time it has been listed on the stock exchange, it fails to trade above the IPO price. The next rally could push the price to a new resistance in the year 2022 at $55 as the price is currently trading at $41.20. The recent bounce is a result of LYFT’s Q4 earnings reports, as price rallies. The revenue rose to $969.9 million from $569.9 million from the previous quarter.  Analysts estimated revenue of $940.07 million. RSI on the daily chart already shows the price has been oversold in December, as the price is currently in the upper region of the Bollinger bands. 

Weekly Chart

Some of these ideas are in our clients’ portfolios. To understand if this one can work for you or for help to invest your own wealth, talk to our advisors at FM Capital Group. Would you like more information on how to get stocks in your portfolio? Schedule a meeting with us here.
Meta Share Slumps, The Worst Day Fall For Any Stock

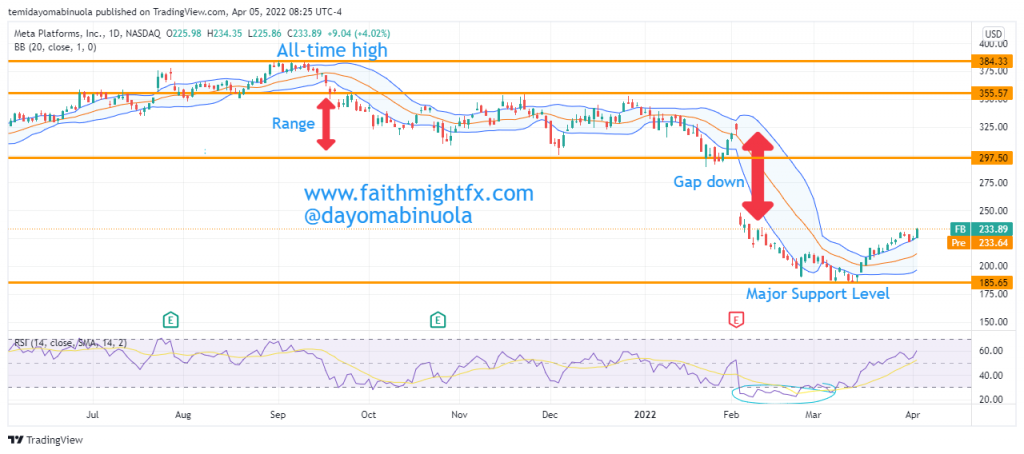
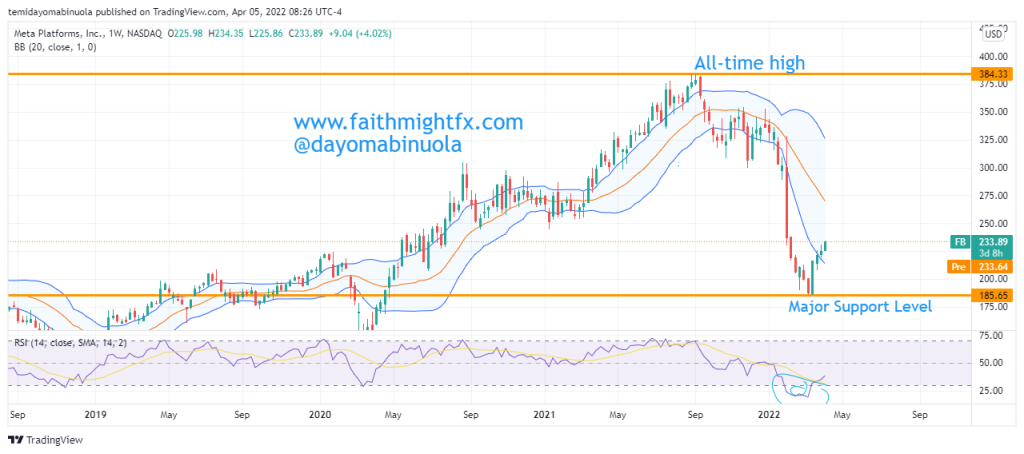
The Facebook parent company, Meta Platform Inc plunged 26% last week Thursday after the release of poor earnings results. About $251.3 billion in market value was wiped out, making it the biggest daily loss for any U.S. company ever. As a result of this fall, Mark Zuckerberg lost over $30 billion. This massive fall of Meta made other tech stocks fall, the likes of Twitter, Snap, and Pinterest.

Weekly Chart

In the year 2021, the opening price of Meta was $274.79 and closed at $332.46. The appreciation in price put smiles on the faces of investors. Now, the reverse is the case this year. The opening price of the Meta stock was $338.26 but now the price is at $237.01, which is a 30% loss from the year’s opening price. Long-term investors have nothing to fear about the most recent dip in the price of Meta. In the coming weeks, the price could rally to $381, which will eventually lead to a new all-time high.  There was a gap down when the market opened last week Thursday as a result of the earnings report. On Friday, Meta’s loss increased because of the continued bearish turn, but at the end of the trading day, there was a rally that formed a Doji. RSI using the daily time frame shows that price has been oversold, which could lead to a possible reversal.

Monthly Chart

Some of these ideas are in our clients’ portfolios. To understand if this one can work for you or for help to invest your own wealth, talk to our advisors at FM Capital Group. Would you like more information on how to get stocks in your portfolio? Schedule a meeting with us here.

S&P500 Bounces After The January Dump

A huge selloff has occurred in the price of $SPX since the beginning of this year after the market opened on the first trading day of the year at $4784.65. On the second trading day which was on the 4th of January, the price reached a new all-time high at $4817.87. The bearish confirmation was on the year’s third trading day after $SPX lost over 80 points in a day.  The month of January was bearish for $SPX after its loss of over 260points, which was almost a 6% loss from the year’s opening price of $4776.61. Just like the American market, the European and the Chinese markets had a poor January as the market was majorly bearish. In January, $SPX had the worst month since March 2020. Our analysts forecasted the price drop of $SPX in one of our articles in January 2022.

4hr Chart

The sell-off in January was due to the Fed signaling its readiness to tighten monetary policy, including raising interest rates multiple times this year to tame inflation that has shot up to the highest level in almost 40years. The $SPX has been a bull market over the decades. The sell-off in January was a normal correction expected in a bull market. The correction of $SPX made the price hit the lowest price in January at $4221.07. A bounce from the dip occurred in the last week of January as a Doji was formed, which could lead to the beginning of price recovery. The bulls are beginning to gather momentum as the price closed at $4505.15, about 7% price appreciation from the January low. As the bulls begin to become more active, the price could reach $4805.68 in the coming weeks. Price has currently crossed to the upper region of the Bollinger bands on the 4hr chart. 

Weekly Chart

In the 12 months of 2021, $SPX had a new all-time high in each of them. $SPX has continued with a new all-time high in January before the dump. Will a new all-time be reached in February?

Some of these ideas are in our clients’ portfolios. To understand if this one can work for you or for help to invest your own wealth, talk to our advisors at FM Capital Group. Would you like more information on how to get venture capital in your portfolio? Schedule a meeting with us here.