fbpx

Microsoft Appreciates After Earnings Report

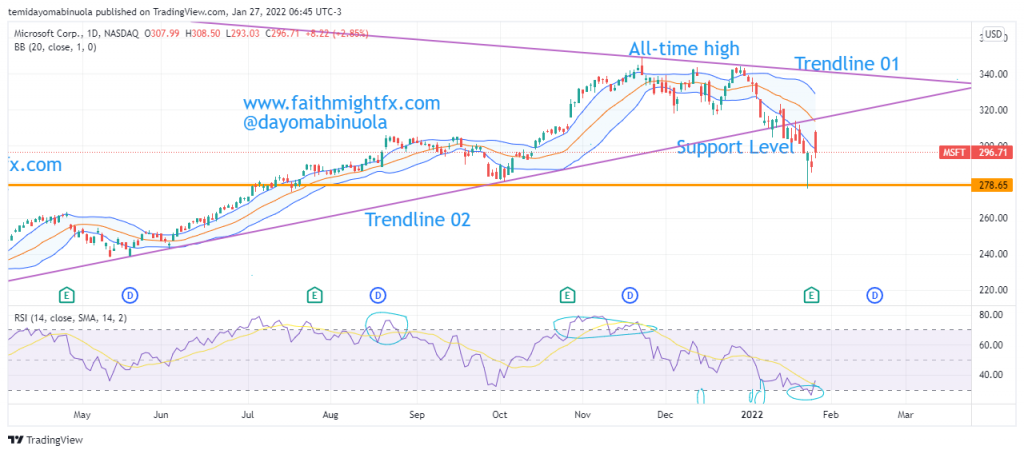
Microsoft reported earnings beat analyst expectations. The earnings per share came in above what analysts had forecast, rising 22.2% year over year. Revenue also surpassed analyst estimates, up 20.1% compared to the same quarter one year ago. Microsoft’s opening price at the beginning of 2022 was $335.87. The price has since fallen to $296.71, making it the worst monthly fall ever. That is an 11% decline since the beginning of the year.

Daily Chart

Furthermore , the company’s shares fell as much as 5% in post-market trading on Wednesday. Over the past year, Microsoft’s shares have made a return of 26.7%. The share price of $MSFT reached an all-time high at $349.69 in November 2021. Before the global market tanked a few days ago, the price had been ranging since that all-time was reached. The price of $MSFT reached $276.02 on the 24th of this month before a price correction. The last time price of Microsoft was at the $276.02 level per share was back in July.

15mins Chart

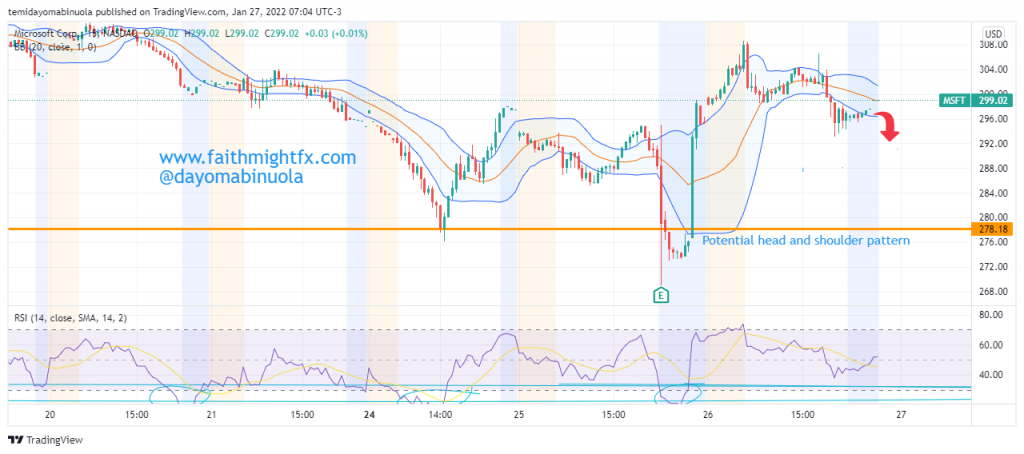
The 15mins time frame is showing that an inverted head and should pattern is about to form, which, in the long run, leads to a massive bullish run. In the next few days, the price should fall to complete the head and shoulder. If this is completed, the price could reach $339.98. The market opened yesterday after a gap-up but closed on a bearish note. The global market has been very bad this week. The next rally might just be what investors have been waiting for since the holidays are over. The RSI daily chart already shows that the price has been oversold. This could be the indication the bulls are expecting.

Some of these ideas are in our clients’ portfolios. To understand if this one can work for you or for help to invest your own wealth, talk to our advisors at FM Capital Group. Would you like more information on how to get stocks in your portfolio? Schedule a meeting with us here.

Robinhood Trades Below IPO price

Robinhood opened at an IPO price of $38 and was valued at $32 billion on the 29th of July, 2021. $HOOD only rallied for a few days after its IPO to reach an all-time high on the 4th of August 2021 at $85.10. The first 5 trading days were the best days for $HOOD investors. Price closed yesterday at $15.17, making it the worst close since its launch on NASDAQ in July 2021. $HOOD has lost 56% in value from the IPO since it currently trades lower than the IPO price of $15.17. This is a huge disaster for Robinhood investors. The current market cap of $HOOD is $12.67 billion. Since its launch in the stock exchange at IPO price to date, $HOOD has lost $25.33 billion. Robinhood has only been trading in the exchange for just 7months.

Daily Chart

Before its IPO, the company had seen massive growth despite the pandemic. Many first-time investors who were given stimulus checks invested in the stock market using Robinhood. As at that time, Robinhood had more than 18 million accounts and 17.7 million active monthly users. Robinhood had 22.5 million active users in 2021. On the daily chart, RSI has shown that the price has been oversold since November 2021. There have been many complaints from Robinhood customers over the inability to place a sell order or to a close position despite losses. We are hoping $HOOD doesn’t get to the point of being delisted from the NASDAQ.

4hr Chart

Some of these ideas are in our clients’ portfolios. To understand which ones can work for you or for help to invest for your own wealth, talk to our advisors at FM Capital Group. Would you like more information on Investment Advisory, Portfolio Services, and VC? Schedule a meeting with us here.

Microsoft Bounces From The Year’s Support

After the all-time high of Microsoft was reached on the 22nd of November, 2021, the price has continued to drop from the highest close on the 28th of December 2021 at $343.00. From the trendline drawn from the all-time high in 2021, the price is yet to break it to the upside. Microsoft investors have little or nothing to worry about, as the price has appreciated in the last two decades. 

1hr Chart

Just recently, Microsoft hired a top Apple Engineer, Mike Filippo, to work on custom chips as it looks to expand its own server-chips efforts, according to people with knowledge of the matter. Filippo’s exit is a huge loss to Apple after he has served as a top designer of semiconductors at ARM for a decade. Microsoft’s 2022 opening price was $335.24. The $MSFT bulls have failed to show up since the holidays were over. Price keeps falling as low as $304.78 on the 10th of January, 2022, making it the year’s support level. A gap-up occurred yesterday from $315.06 to $319.57.  This might lead to price recovery as our analysts look forward to the price of Microsoft reaching $341.48.

Daily Chart

There is no indication of price reaching a new all-time high as we look forward to receiving the earning report of Microsoft on the 25th of January 2022. On the daily chart, RSI shows the price is overbought while on the 1hr chart price is currently oversold. The hire of Filippo might boost the share price of Microsoft in the coming weeks. The trendline 01 on the chart shows that price is on a bull trend despite the bad start in 2022. RSI though shows price is overbought on the chart.

Some of these ideas are in our clients’ portfolios. To understand which ones can work for you or for help to invest for your own wealth, talk to our advisors at FM Capital Group. Would you like more information on Investment Advisory, Portfolio Services, and VC? Schedule a meeting with us here.
Apple Market Cap Hits $3Trilliion

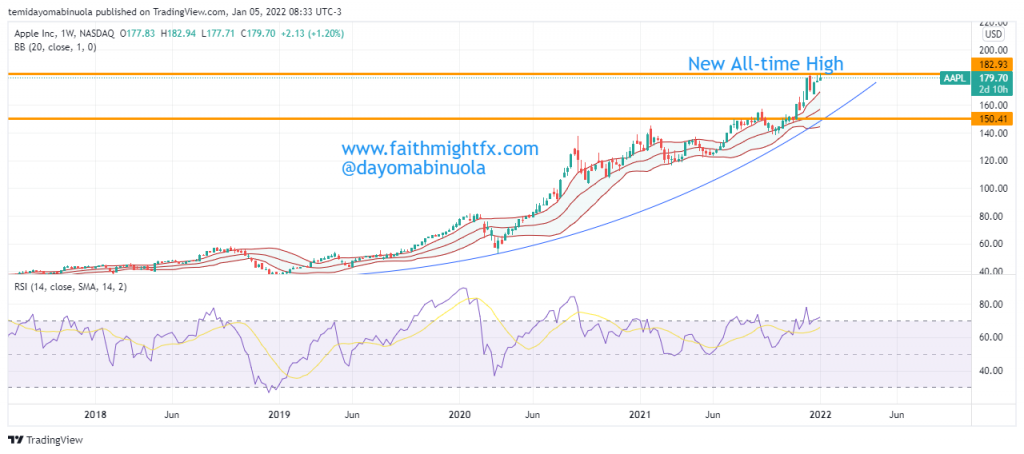
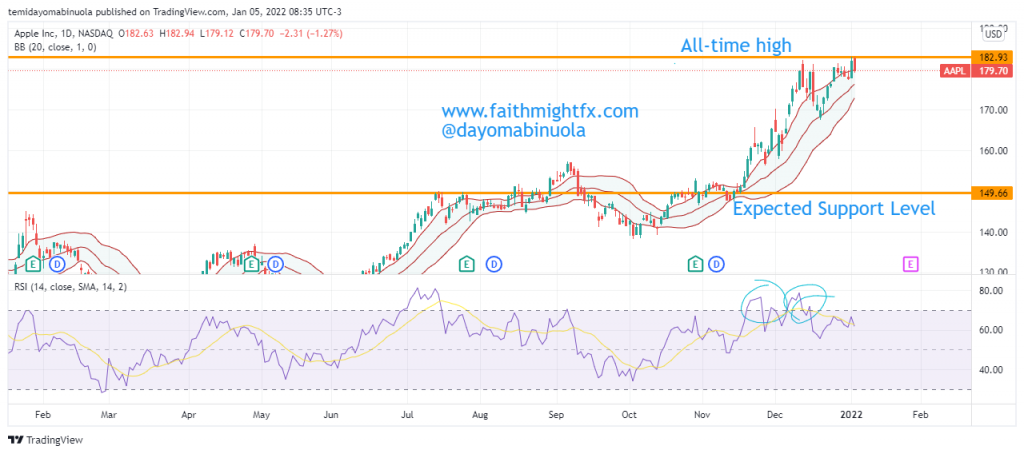
Apple becomes the first company in America to reach the new milestone of $3Trillion Market Cap.  The technology company has done tremendously since the pandemic. The pandemic lowest price was $53.32. The current price stands at $179.70 which is a day after the all-time high at $182.93 was reached. Therefore, investors have gained about 3x since the pandemic low.  Since Tim Cook became the CEO of Apple on the 24th of August 2011, there has been a massive rally in the share price of Apple. He has been able to achieve about 10X in the last decade. The market cap has jumped from $340billion to $3Trillion.  Apple investors have been enjoying a jolly ride due to good leadership. 

Weekly Chart


In December 2021, our analysts concluded that the price of $AAPL should reach a new all-time high, which might eventually take the market cap to $3Trillion as a result of continuous profit-making. Going forward, a correction might occur which leads to the market cap dropping from $3Trillion. Apple’s share price might drop about 18% in the coming weeks, which might eventually bring the share price down to $149.07, a level below the September 2021 all-time high of $157.55. Since the latter months of 2019, the price of Apple has been overbought multiple times, as the price only had a few corrections. Meanwhile, there is no indication of price reversals.  

Daily Chart

Some of these ideas are in our clients’ portfolios. To understand which ones can work for you or for help to invest for your own wealth, talk to our advisors at FM Capital Group. Would you like more information on Investment Advisory, Portfolio Services, and VC? Schedule a meeting with us here.
Will The Name Change of Square To Block Affects Its Share Price?

After 6 years of Square being listed on the stock exchange, the CEO Jack Dorsey, who owns 24.4% of the company, changes its name to Block. The main reason for changing the name is for expansion as the company intends to focus on new technologies such as blockchain. Before now, Square was known for digital payments with a focus on point-of-sale terminals and auxiliary equipment to process debit cards. Since its IPO in 2015 at $9, the share price has done 31X as it reached an all-time high in August 2021 at $289.05.

The lowest price of $SQ during the lockdown was $38.02. As the lockdown eased up, price appreciated above $200 before the end of last year. The price movement of $SQ in the last 11 months has been between $192.15 and $289.05. The range in the weekly and monthly chart has been broken to the downside this week as the price reached $185.72. $SQ is currently not showing an indication of a price reversal to the upside. Since the day Square has been changed to Block, the price of $SQ has gone south.

Some of these ideas are in our clients’ portfolios. To understand which ones can work for you or for help to invest for your own wealth, talk to our advisors at FM Capital Group. Would you like more information on Investment Advisory, Portfolio Services, and VC? Schedule a meeting with us here.

Zoom’s Share Price Falls Further

Zoom’s investors had a good return in 2020 after the price opened at $67.23 to reach an all-time high of $588.21, which is over 8X. During the lockdown, many meetings and conferences were held virtually as Zoom was the favorite of many organizations. However, 2021 is the worst year for $ZM investors since its IPO in 2019. The opening price for Zoom this year was $337.07. As offices began to open due to the mass vaccination of people in different countries across the globe, the price of Zoom began to fall. The hope that showed in July 2021 as a result of the monthly candlestick was dashed away when all gains were lost in August 2021.

Daily chart

The current share price of Zoom is at $218.79 which shows that Zoom investors have lost 35% from the opening price of this year. A breakout to the downside has occurred from the August 2020 support level at $233.23. Is this going to be a continuous downtrend? The next few weekly candlesticks will determine the next direction. The share price of Zoom is currently at the lowest since June 2020 at $211.41. There are tendencies that the share price of Zoom might rise to $400 as many countries begin to lock their borders due to the new cases of the Omicron variant of the coronavirus. As countries begin to lock borders, this might eventually affect the workspace. Companies might fall back to the remote ways which worked during the lockdown.

Weekly chart

Some of these ideas are in our clients’ portfolios. To understand which ones can work for you or for help to invest for your own wealth, talk to our advisors at FM Capital Group. Would you like more information on Investment Advisory, Portfolio Services, and VC? Schedule a meeting with us here.

Twitter Has Lost All Its 2021 Gains

Twitter’s opening price at the beginning of 2021 was $54.22. Later in the first month of the year, the price fell to the lowest level in the year at $45.59. After the price fall to $45.59, the price rallied in February 2021 to reach an all-time high at $81.09. Since the all-time high was reached, prices began to go lower. There have been lower lows and lower highs, which has resulted in huge losses as all the $TWTR gains of 2021 have been lost. Twitter is currently at a -16% loss from the opening price of the year.

Weekly Chart

After Thanksgiving Day, the market opened at $46.54 and closed at $47.10. But on the 29th of November 2021, the price had a gap up from $51.84 which showed a bit of hope until Jack Dorsey announced his resignation as the CEO of Twitter. The share price of $TWTR closed at $45.78 yesterday after Parag Agrawal was announced as the new CEO of Twitter. Price is currently around the year’s support level at $45.59. RSI is currently at the oversold position even after the price is around the support level.

Daily Chart

The gap up at the opening of yesterday’s share price for Twitter made the price reach the upper region of the Bollinger Bands, but the price crossed lower to the lower region of the bands at the close of the market. There may be a call for the bulls as a new CEO is appointed. A few Indian-American CEOs have emerged as the CEOs of American Tech Companies, and their share prices have been doing excellently. As the Twitter bulls become more active, the price might reach $66 in the coming weeks.

Some of these ideas are in our clients’ portfolios. To understand which ones can work for you or for help to invest for your own wealth, talk to our advisors at FM Capital Group. Would you like more information on Investment Advisory, Portfolio Services, and VC? Schedule a meeting with us here.
SPX Had A Price Correction

S&P 500’s opening price in 2021 was $3699.90. Price has been appreciating leading to different all-time highs. The SPX has done so well with return for investors as each month since the beginning of this year, there have been new all-time highs reached. The latest all-time high was reached at $4,745.40. This week has been very bad for $SPX has the price fell to $4,594.61 from the weekly opening price of $4711.61. Many stocks’ prices fell during the week as a result of the new variant of coronavirus discovered in South Africa named ‘Omicron’. A few countries are back to a lockdown to avoid the spread of the various. Countries are beginning to restrict movement to and from South Africa. As of July 2021, there are four dominant variants of the Coronavirus.

On the weekly chart, the $SPX closed this week with a bearish candlestick. Looking at the 2020 chart of $SPX, especially before the spike in the cases of Covid-19 globally, the then all-time high in February 2020 was at $3384.11, the price fell to $2210.48 in March 2020. Since the lockdown, the price has been appreciating as price doubled since the lockdown has been eased. The support level at the second half of this year is maintained at $4284.31. The weekly charts show the candlesticks are still in the upper region of the Bollinger bands despite RSI showing that the price has been overbought. The bulls are still very active despite the correction this week. The price of $SPX might appreciate in the next few weeks, which might lead to a new all-time high above $4,800.

Some of these ideas are in our clients’ portfolios. To understand which ones can work for you or for help to invest for your own wealth, talk to our advisors at FM Capital Group. Would you like more information on Investment Advisory, Portfolio Services, and VC? Schedule a meeting with us here.
The Next Bullish Run of Disney

The Disney share price is one of few stocks that has lasted over 50years and still brings returns to its investors. There was a setback to the Disney price in December 2019 after the price reached a new all-time high then at $154.16. Disney lost about 50% of its share value between December 2019 and March 2020, which was a result of the pandemic, making it the worst price dip since its IPO. After lockdowns were eased across the world, price began to appreciate. The price appreciation broke out the then resistance level at $154.16 to a new all-time high at $203.12 in March 2021. Since the worst fall of Disney during the 2020 pandemic, $DIS has appreciated almost 2X of its return.

In the last month of 2020, the price broke out of the resistance level at $154.16 which led to the price reaching the new all-time high at $203.12. Since the all-time high was reached, the $DIS share price has lost about 31% of its value. In this month alone, $DIS has lost about 15% of its value. Should investors be worried about the price fall? The recent price fall could not break out to the downside of the support level at $154.16. A possible correction around the support level might occur which might eventually push the price of $DIS to $175.72.

Some of these ideas are in our clients’ portfolios. To understand which ones can work for you or for help to invest for your own wealth, talk to our advisors at FM Capital Group. Would you like more information on Investment Advisory, Portfolio Services, and VC? Schedule a meeting with us here.

Facebook Changes Name, Share Price Might Rise

Facebook Inc has been in the middle of a crisis for a while, which has negatively affected the share price since the beginning of September. On the 28th of September, Facebook Inc changed its name to “Meta Platform Inc”. There is a new technology named metaverse, which is termed surround-yourself technology, the CEO is committed to developing the technology, which I believe must be one of the reasons for the name change. The social network name is still called Facebook. Also, the leadership of Facebook Inc remains unchanged.

4hour Chart

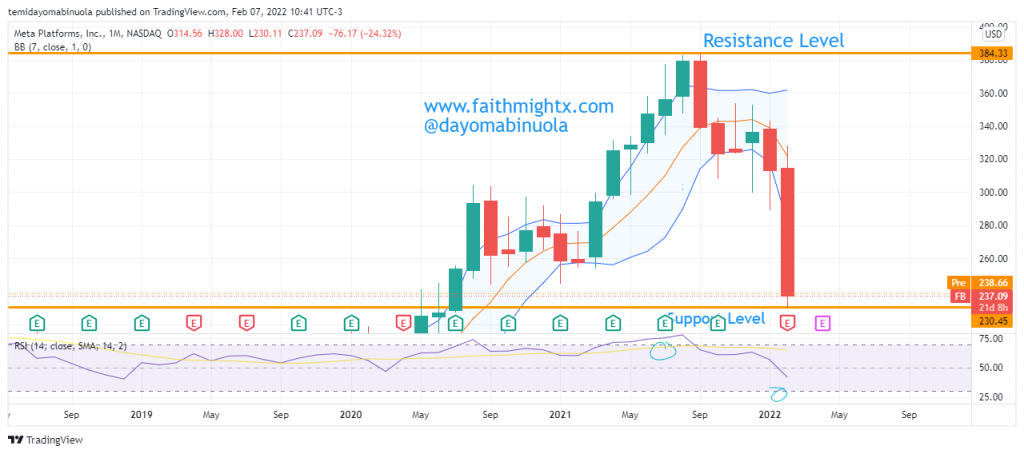
The metaverse brings the internet to life or is rendered in 3D. Zuckerberg has described it as a “virtual environment” you can go inside of, instead of just looking at it on a screen. People can meet, work and play, using virtual reality headsets, augmented reality glasses, smartphone apps, or other devices. It has been said that Facebook will spend $10billion this year on the new technology. RSI has shown two oversold positions in September and October on the 4hour chart, after the dip in September. An upward breakout of the trendline occurred this October before the dip continued to reach new support at $308.17. The price movement shows the bulls broke the trendline again. With the introduction of the metaverse, Facebook might begin a major bullish movement back to the all-time high at $384.33

Daily Chart

The Daily chart shows it clearly that all profits made in the second half of this year have been lost as a result of the recent dip in September. Yesterday ended a bullish note as the Facebook name was changed to Meta.