After a week of consolidation in sterling, GBP pairs are a mixed bag as this new trading week gets underway.
GBP/USD
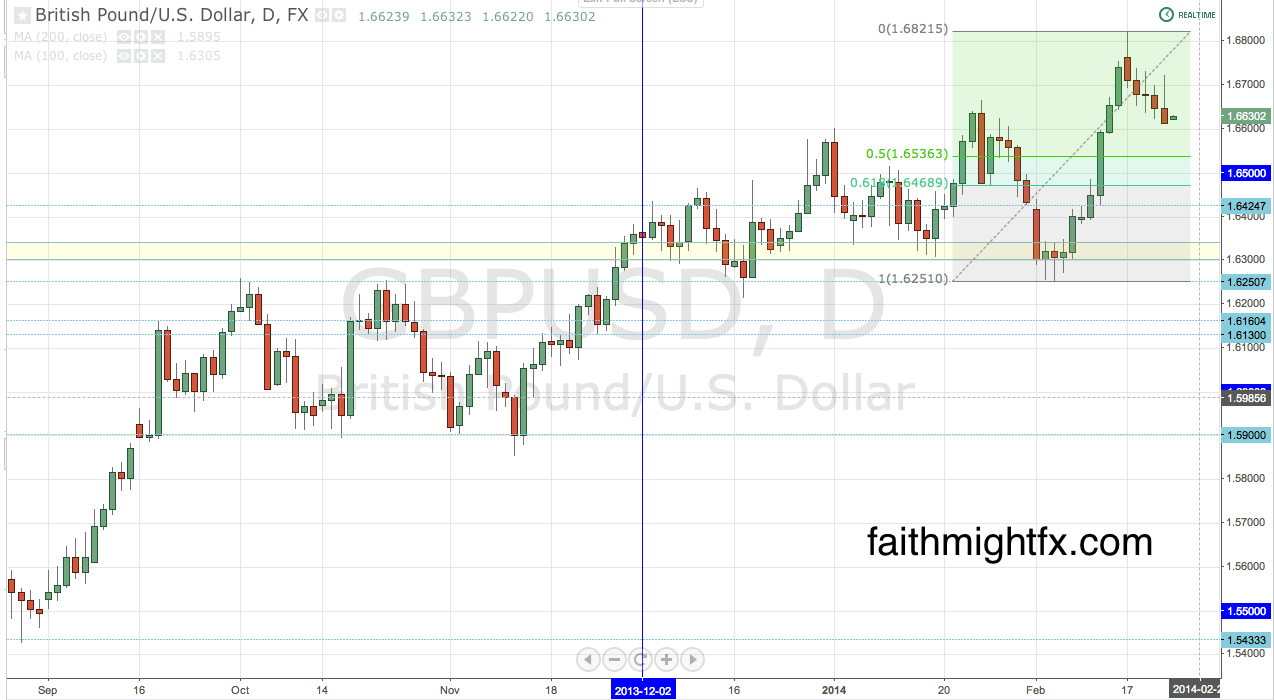
Though $GBPUSD has moved off its recent multi-year highs, it has been a volatile and choppy ride lower. Expect more of the same again this week, as this pair continues to correct lower towards 1.6500. I believe big time buyers are set up all around 1.65 between the 50% and 61.8% Fibonacci retracement levels. A move from these levels supports a rally to 1.7000 mid term.
EUR/GBP
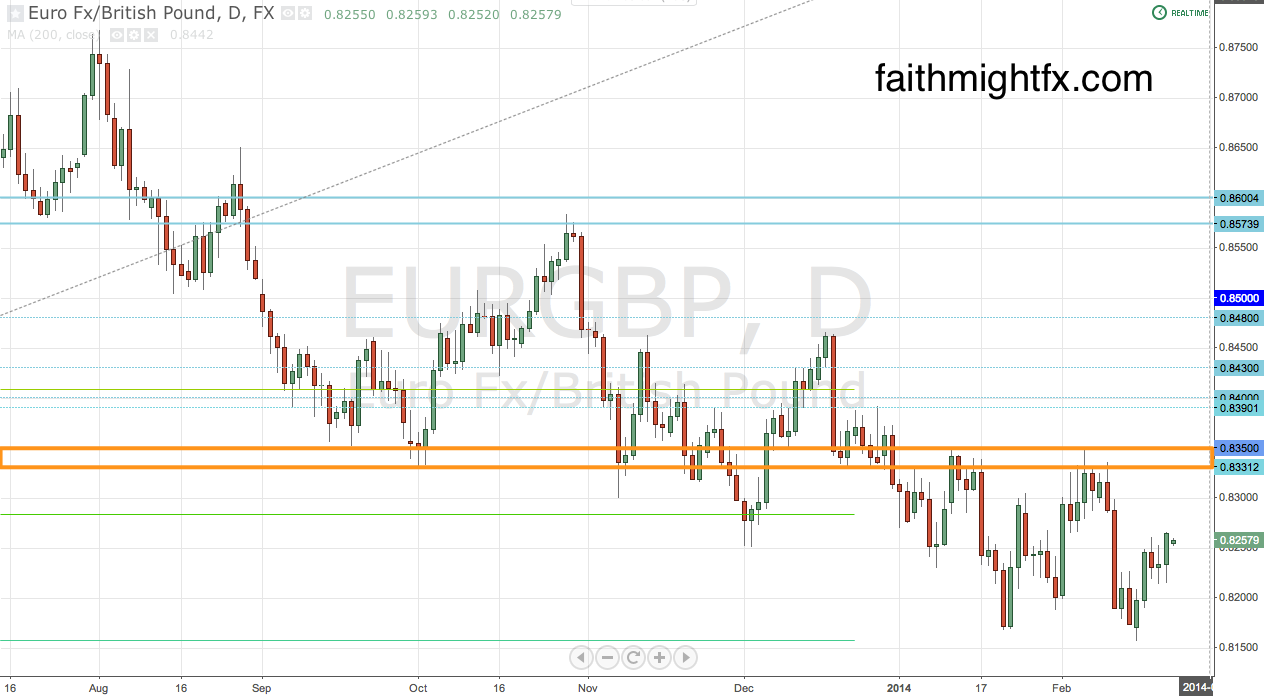
The $EURGBP spent all last week struggling at the 0.8250 level. On Friday, however, price broke above 0.8250 and held the level to close the week. While the daily chart is in a clear downtrend, price is holding support at the weekly chart’s 61.8% Fibonacci retracement level. This correction has the potential this week to continue higher to the zone between 0.8330 and 0.8350. From here, it will be decision time. But the odds are with the bears as GBP could catch another bid and push price back to lows.
GBP/CAD
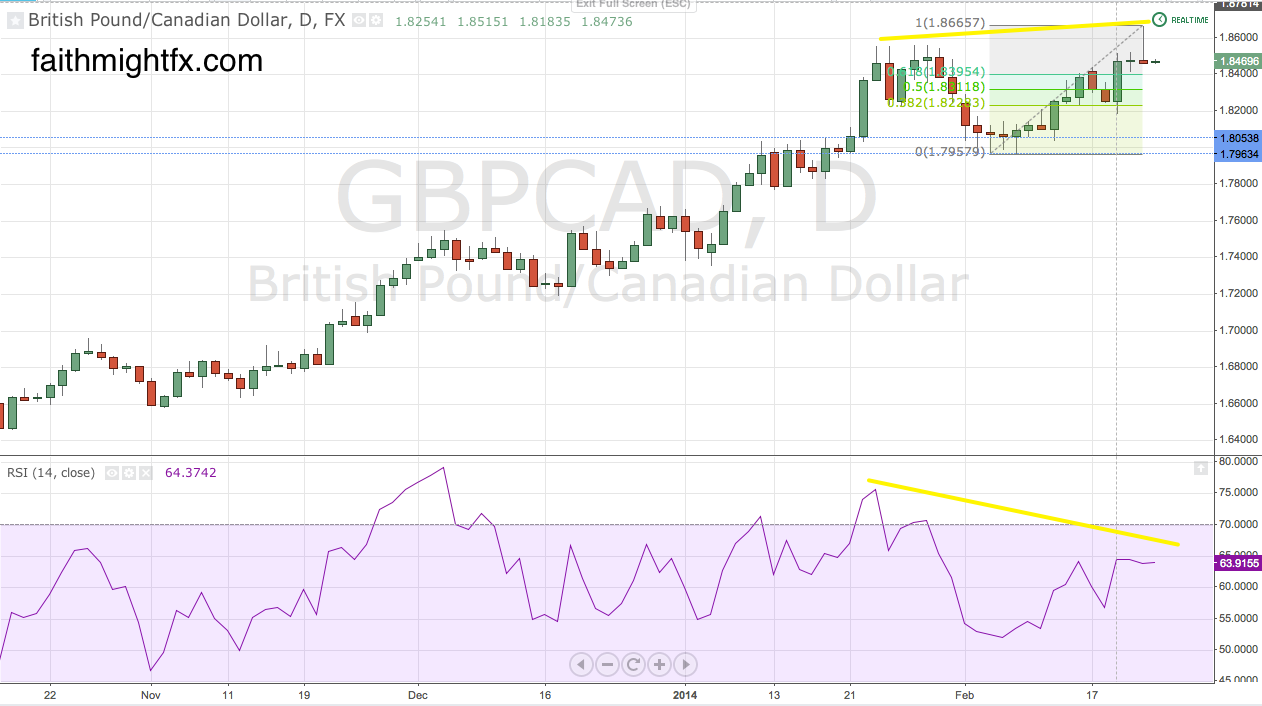
While $GBPUSD and $EURGBP consolidate, the $GBPCAD price action has remained bullish . Candaian fundamentals keep the $GBPCAD well supported on dips. Dips due to GBP weakness have been bought below 1.8500 as CAD fundamentals continued to deteriorate. For some reason the Canadian economy is falling into recession even as the US, its largest trading partner, has remained robust. This pair will continue to have issues getting higher as long as cable is weak. Once $GBPUSD starts to show strength again, the $GBPCAD should find conviction higher again.
GBP/NZD
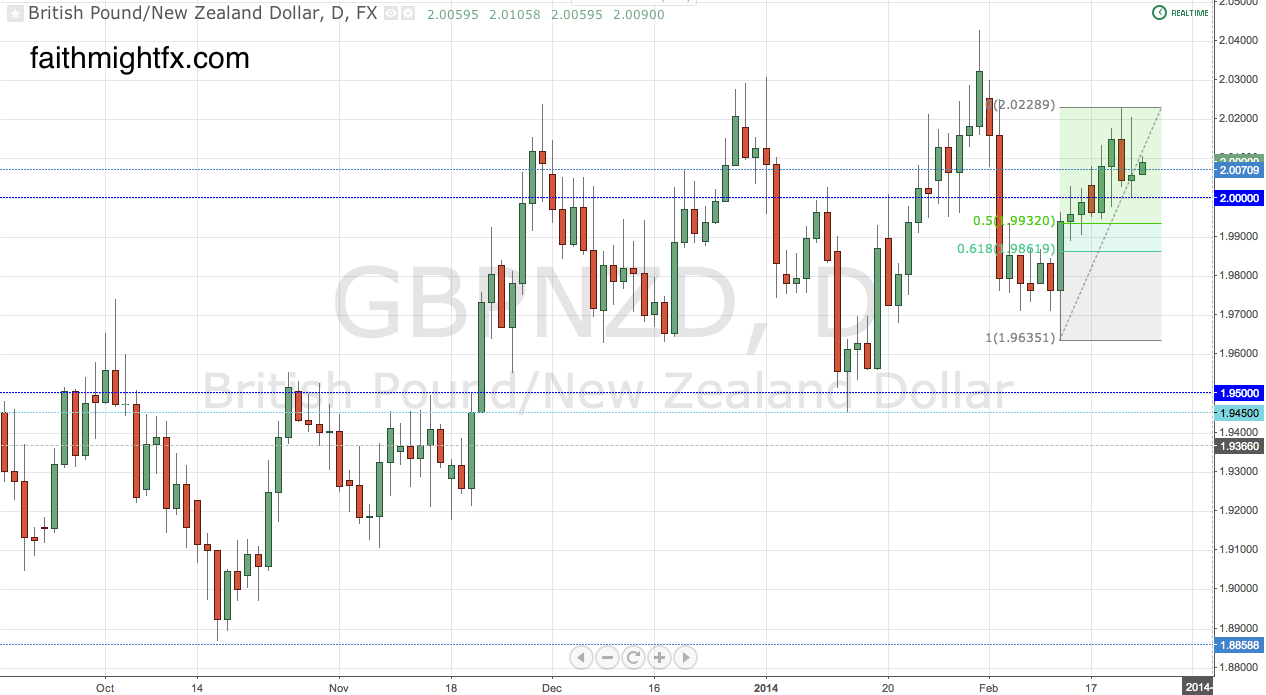
The $GBPNZD has remained very bullish closing the week above the almighty 2.00 level. As the $GBPUSD continues its consolidation lower, there is major positioning occurring at this major psychological level in $GBPNZD. It has been a whipsaw at the highs but as long as the overall GBP bull trend remains in place, this pair is poised for 2.05 mid term.
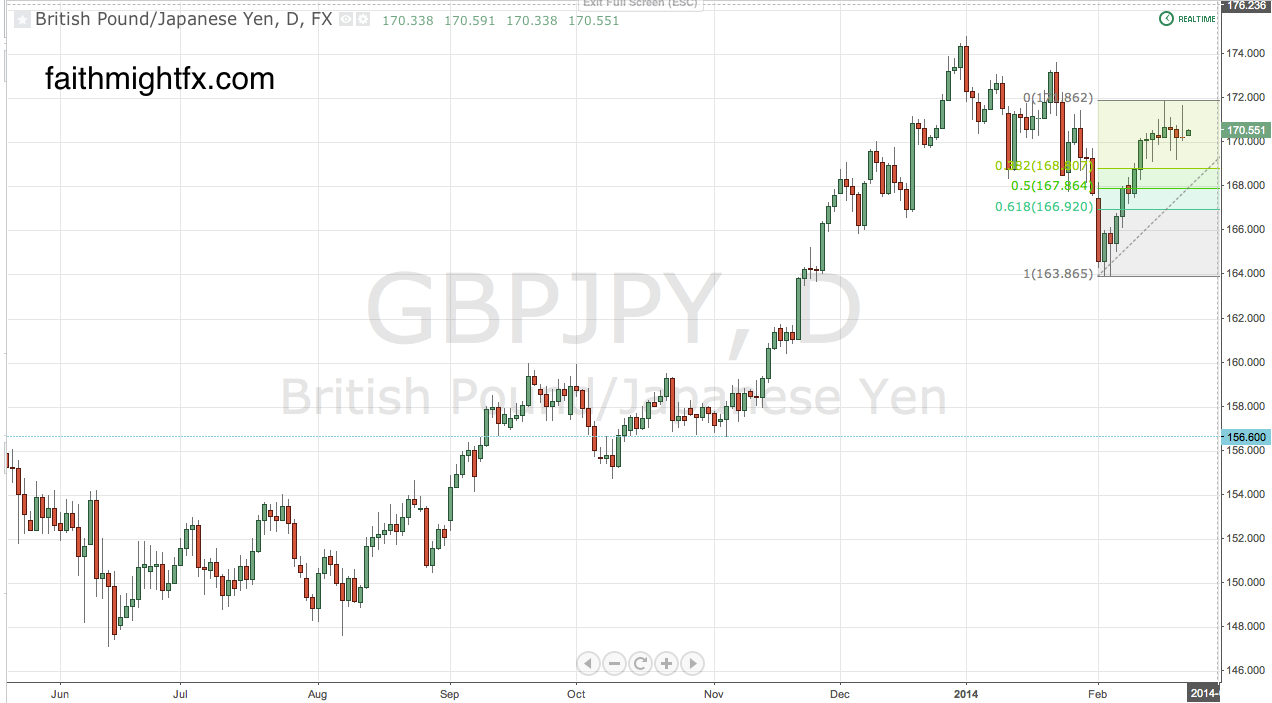
GBP/JPY
The $GBPJPY has remain elevated as equity markets bounced higher to the 2014 resistance levels. This week, all eyes on US stocks and emerging markets as 2 wars ended this weekend. The stage is set for risk to rally higher as geopolitical events turn towards peaceful resolution. As $GBPJPY opens this week above 170.00, the bullish sentiment favors buyers even as the trend still remains corrective below 175.00.
All these charts suffice it to say that sterling is smoking hot. A trend that can correct is only headed higher. And a trend that holds up during consolidation has the makings for a major breakout. $GBPUSD is the pair to guague timing in the GBP crosses during this time of consolidation. Once major levels are reached in cable, sterling may rock out across the board once again. Or not. Price will ultimately tell.
Disclosure: I am long $EURGBP as of this writing since last week.
Leave a Reply