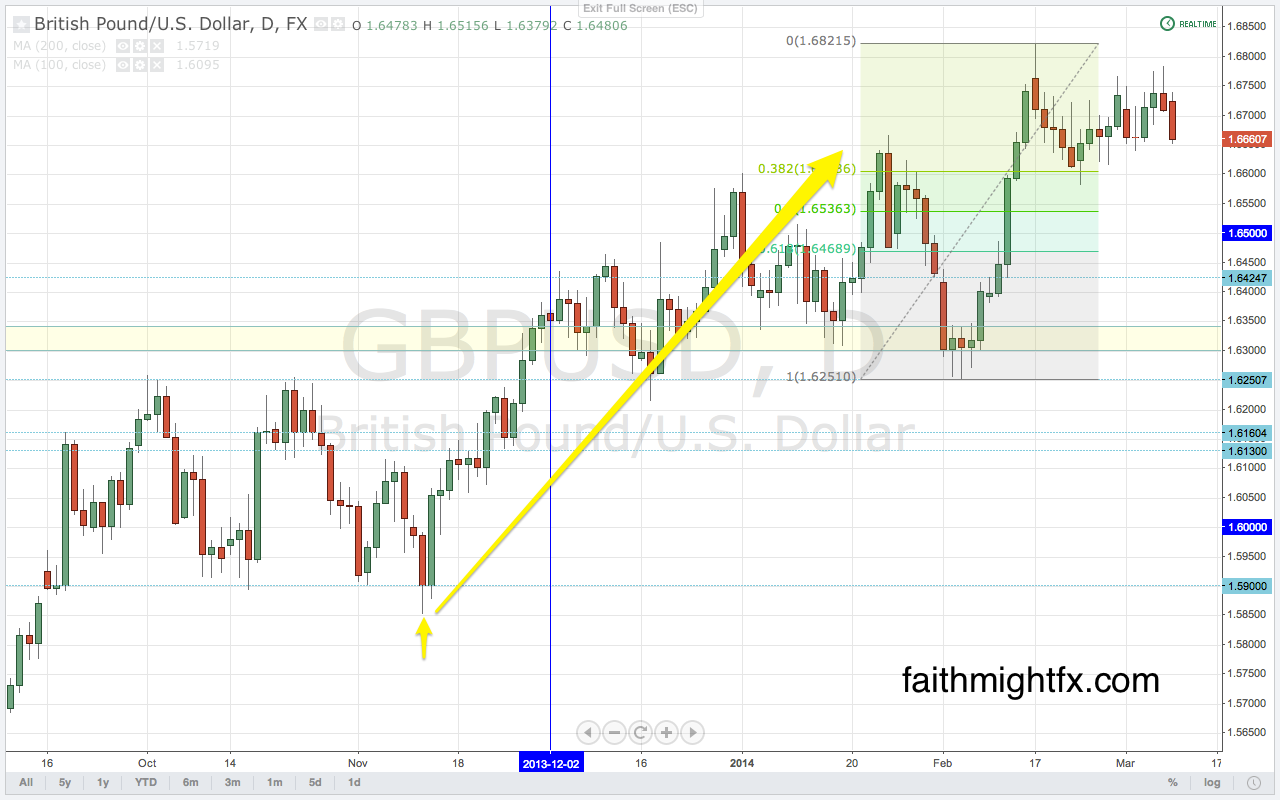
GBP/USD
No real change in the last 2 weeks as cable remains rangebound during its consolidation. Price action reminds me of the price action back in October when price finally broke above 1.60. Cable consolidated in a range between 1.61 and 1.59 for that entire month. It wasn’t until price broke down to the then 50% Fibonacci retracement level at 1.5850 that price resumed its monster breakout to new highs above 1.63. I believe that is same price action we have now and price will not resume higher above 1.6820 until we see price fall to 1.6550/00.
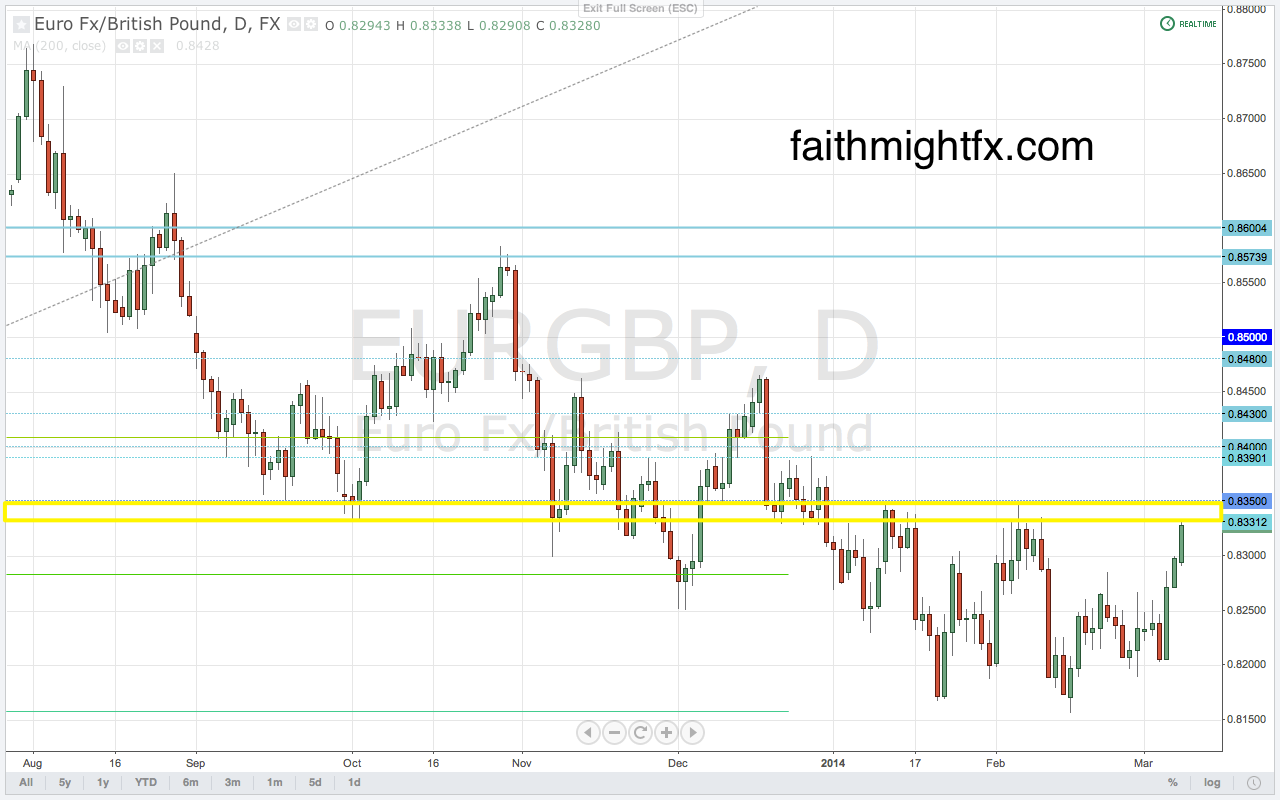
EUR/GBP
The $EURGBP has finally broken higher above 0.8300 and has moved right into the resistance level at 0.8330. Between here and 0.8350 is a potential sell zone for a move back to the lows at 0.8160. If $EURGBP buyers are to gain anymore traction, there must be a daily close above 0.8350 to signal a sustained move higher to 0.8400.
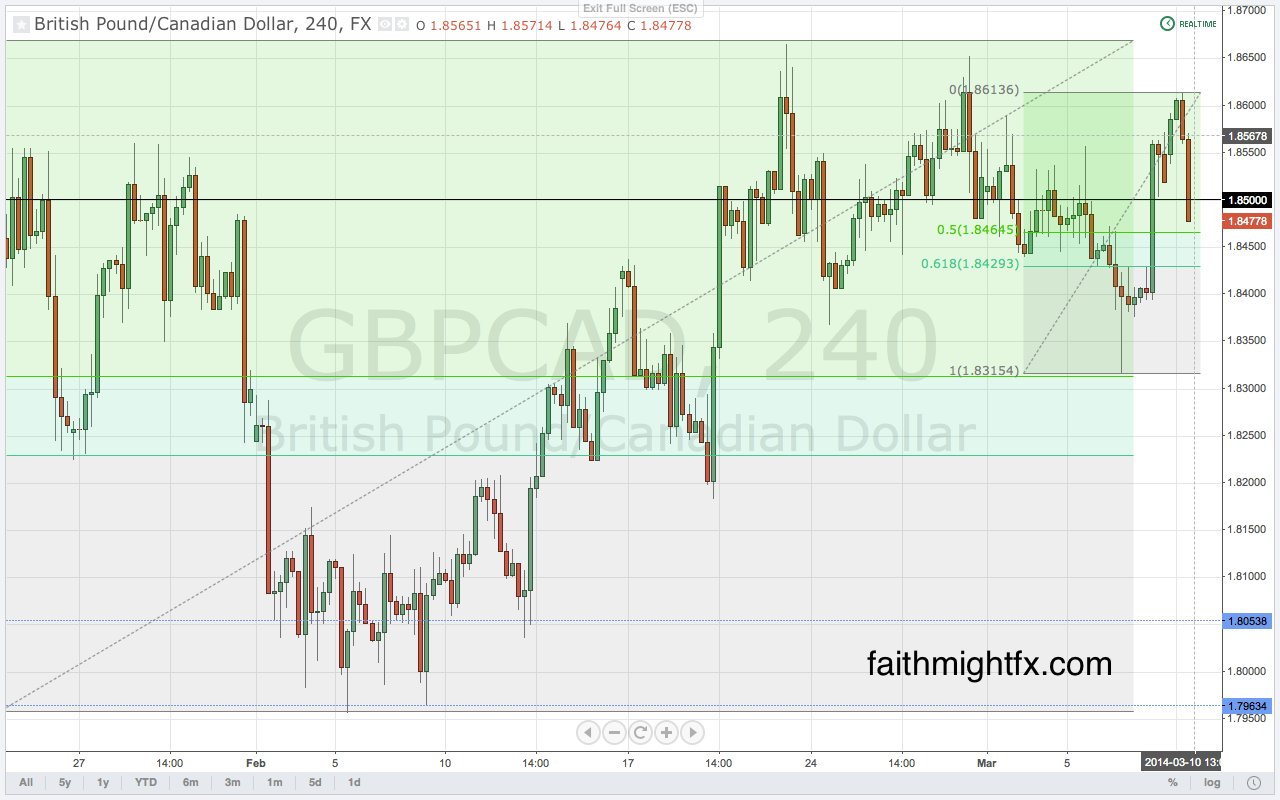
GBP/CAD
As Canadian fundamentals continue to deteriorate (Friday’s jobs report showed Canada lost jobs last month), the $GBPCAD will remain bid even as sterling continues to consolidate. The major psychological level at 1.85 remains a level where traders see major positioning for when GBP strength returns. The $GBPCAD has found staunch resistance at 1.86 but still targets 1.90 midterm.
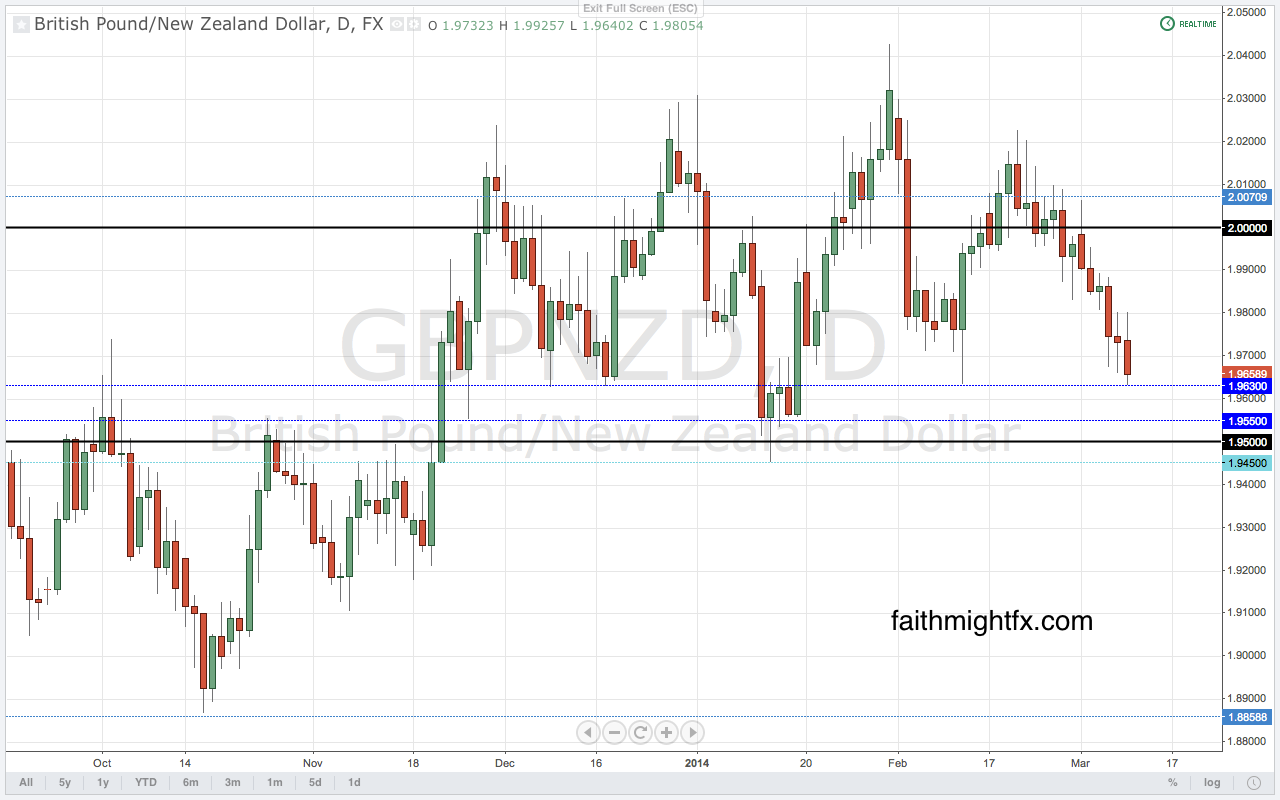
GBP/NZD
I’d imagine there is some serious positioning going on in the $GBPNZD right now too. This pair actually had some real movement falling over 350 pips in the past 2 weeks. Price sits at the bottom of this consolidation range as the week opens. It’s a light week out of the UK but the Reserve Bank of New Zealand could surprise markets. Likely more jawboning but geopolitics have changed quite a bit with this Ukraine-Russia situation and commodity prices have firmed. 1.95 is key support into the rate decision.
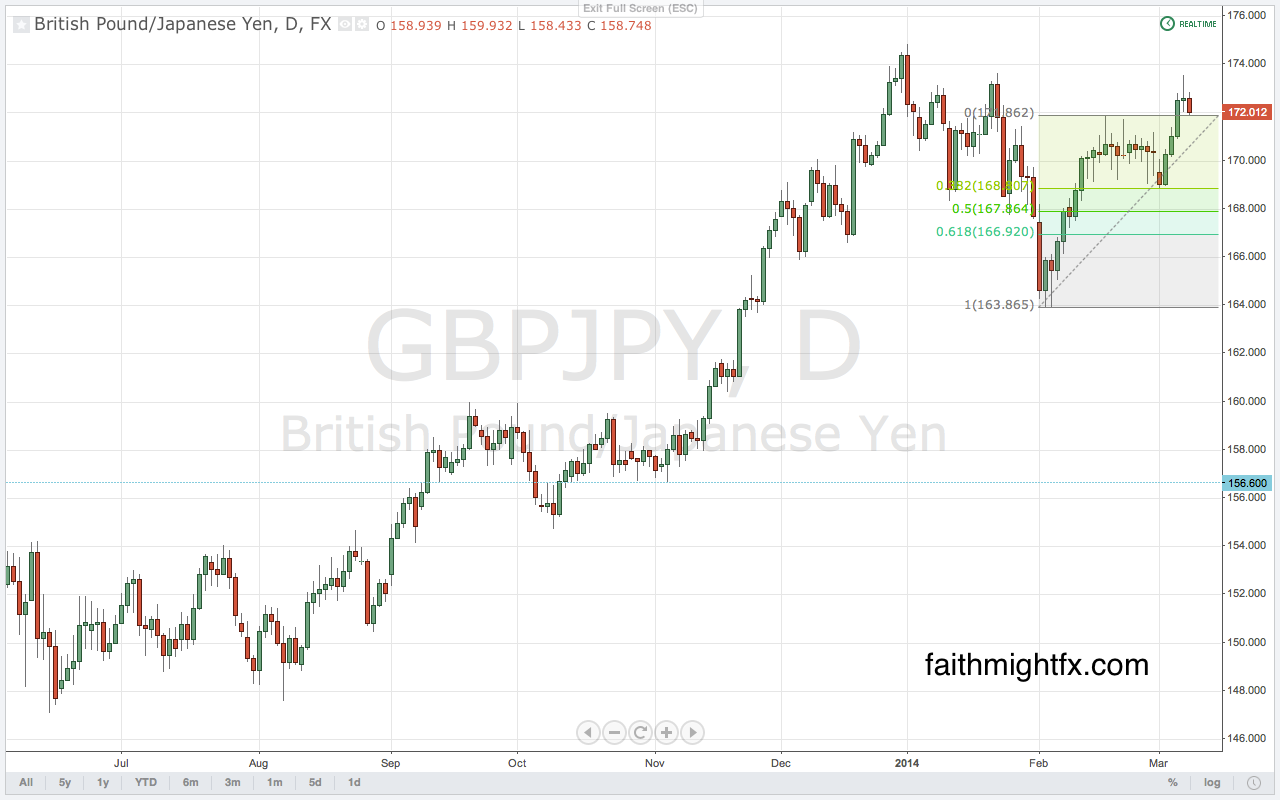
GBP/JPY
The Bank of Japan is set to deliver a monetary policy announcement this week too. The $GBPJPY opens the week at the 172.00 former highs after moving off the new highs at 173.55. A correction lower sees support at 171.50. However, $GBPJPY remains bullish above 170.00.
Compare:
The Week Ahead In Charts (FMFX)