This is the first time that $FB has ever revisited lows on the monthly chart. Here, on the weekly, this is nothing new. The contrasting price action in these timeframes suggests that if September ends the month, and quarter, at new lows, $FB becomes very vulnerable heading into election season and the last quarter of the year.
Ever since $FB broke above $55 after a brief pullback at the then-highs, there has not been a dip that revisited after the recovery. The fact that price is not only below $200 after making the new all-time high at $218.62 back on July 25th, it is back at the previous lows. Price stands less than twenty dollars shy of those Cambridge Analytica lows of 149.02, as of this writing.
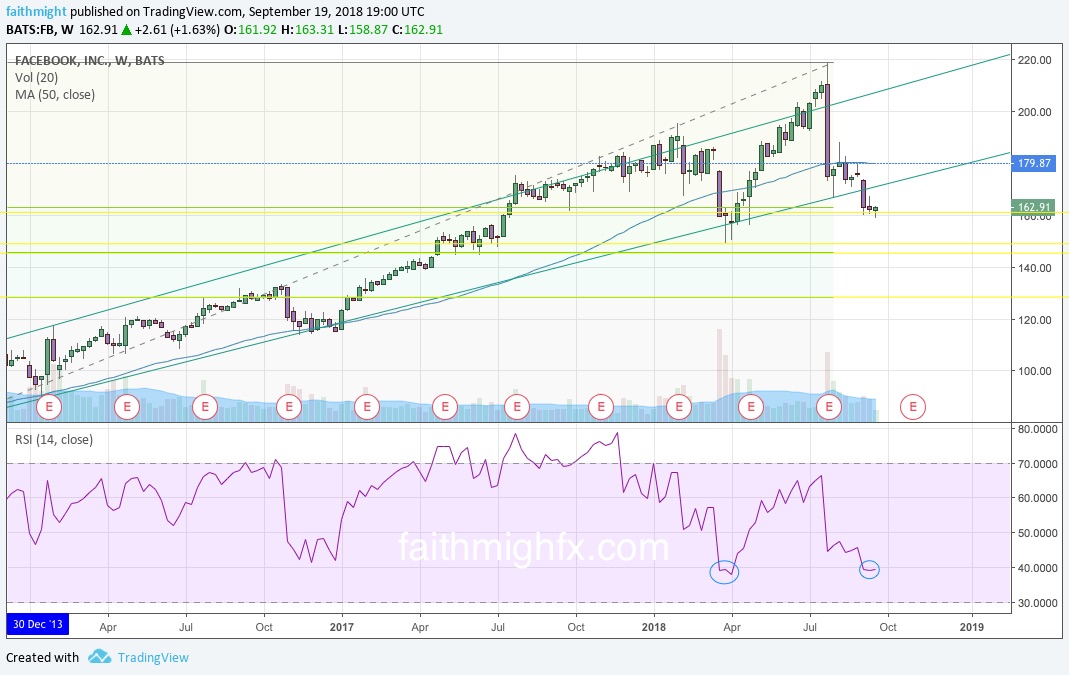
Price is also sitting on the 38.2% Fibonacci retracement. It could hold here. Or break lower. The real question becomes what do you below $149 or above $200? My answer to you: what is your timeframe?