NASDAQ is an acronym for the National Association of Securities Dealers Automated Quotations. It is an American stock exchange based in New York City. It is the most active stock trading venue in the US by volume, and ranked second on the list of stock exchanges by market capitalization of shares traded, behind the New York Stock Exchange. Nasdaq was founded in February 1971, and has a listing of 3,554 companies. The market capitalization of Nasdaq is $18trillion as of January 2023.
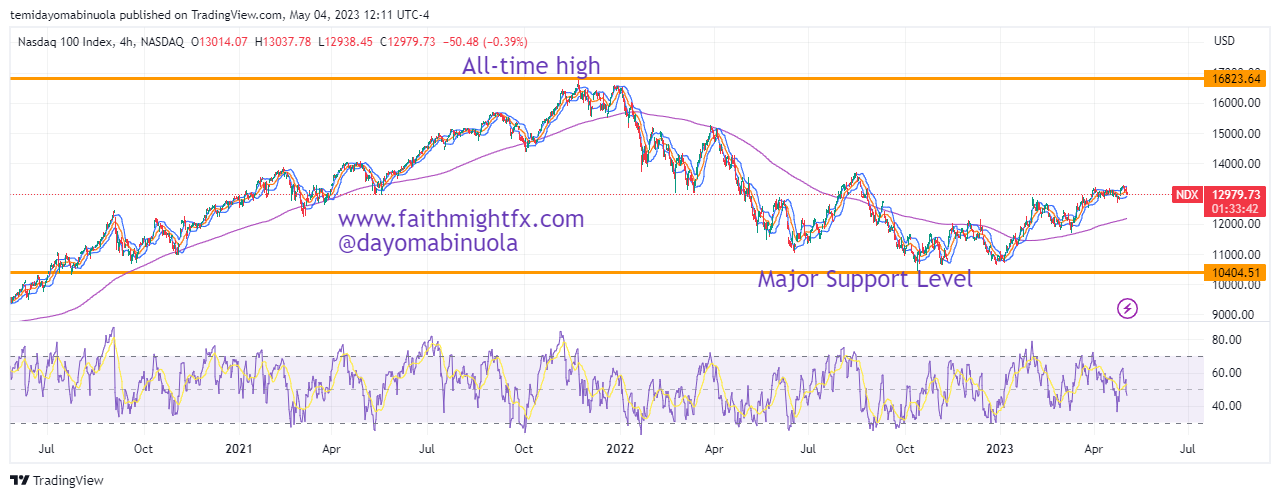
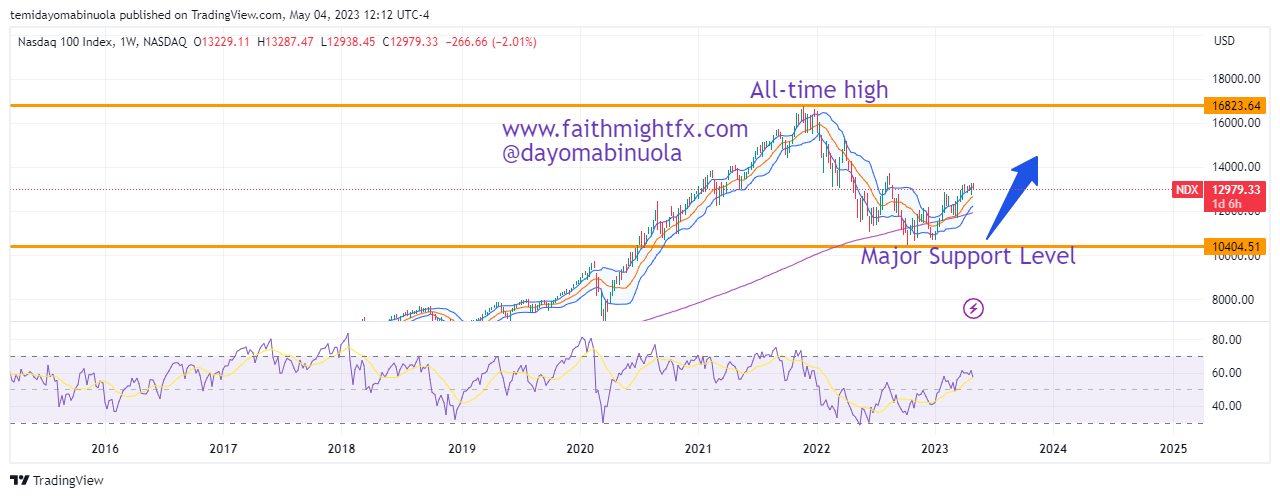
The Nasdaq in the last two decades has mostly being bullish. The all-time high of NASDAQ was at $16,745 in November 2021. After the all-time high was reached, price dipped to $10479 in October 2022. Price consolidated for a few months until a rally began in February 2023. As of the time of this writing, the current price of NASDAQ is at $13013, an 8-month high. As this rally continues, we might see the price of NASDAQ hit $14,000 in the coming weeks.
Some of these ideas are in our clients’ portfolios. To understand if this one can work for you or for help to invest your own wealth, talk to our advisors at FM Capital Group. Would you like more information on how to get stock indices in your portfolio? Schedule a meeting with us here