Looking at the Monthly chart, the lowest price ever that USDJPY reached was 75.486 which was in October 2011. This price became the support at that time and it lasted from that time up until February 2012. Price began to rally in February 2012 and USDJPY has been majorly bullish ever since then, with little pushback from the bears which occurred in 2016.
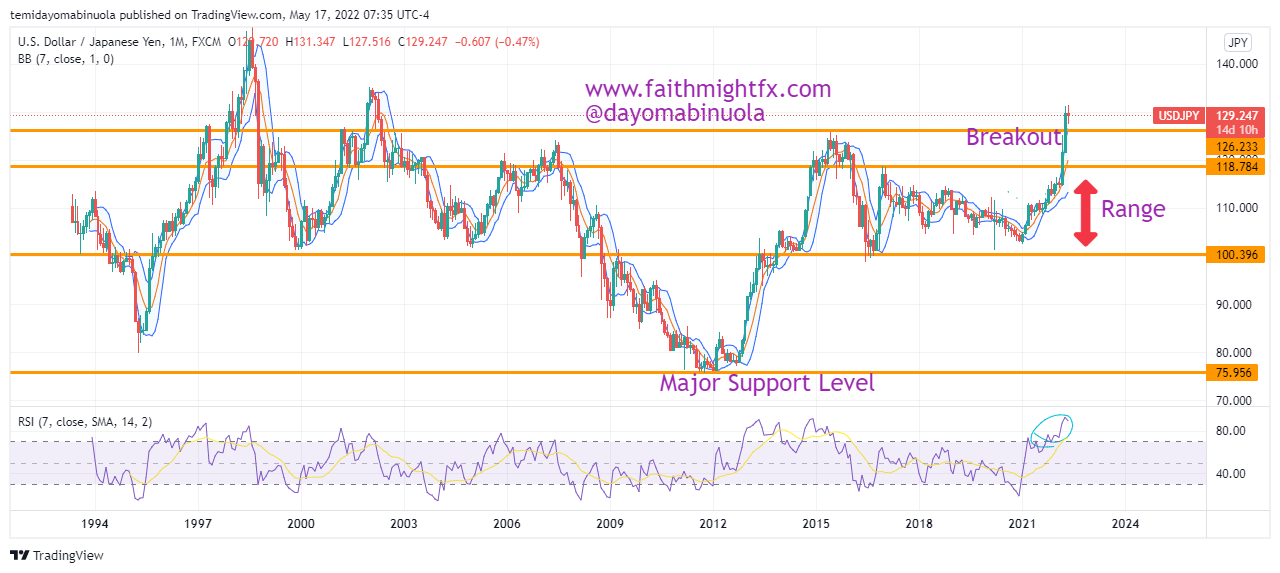
In 2015, resistance was established at 125.647 but this correction that occurred in 2016 caused a dip in price to 99.009. In 2017, the pair got caught in a range that stretched until 2021. The upper limit and the lower limit of the range were 118.382 and 101.162 respectively. In 2022, this range was cleared up and the price broke 2015 resistance, which reached a new high at 131.298 in April 2022. The last time USDJPY hit this mark was in April 2002.
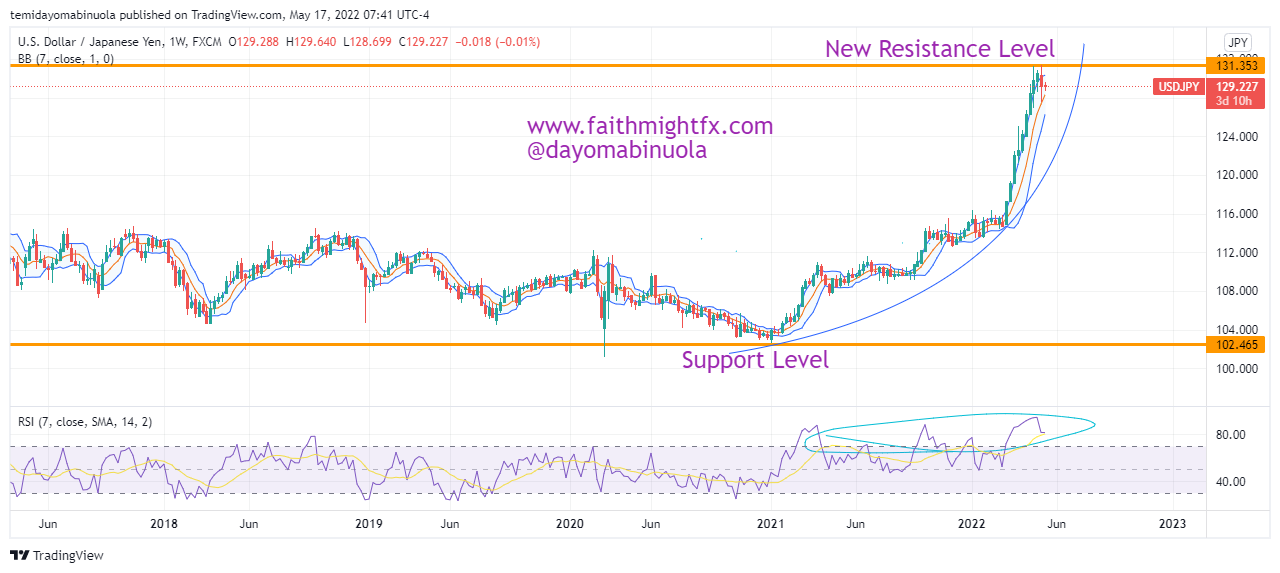
As of May 17, 2022, USDJPY is at 129.346. On the daily, weekly, and monthly charts, RSI is overbought. This means that, from a technical analysis standpoint, price looks to fall below 127.500 in the coming days.
Some of these ideas are in our clients’ portfolios. To understand if this one can work for you or for help to invest your own wealth, talk to our advisors at FM Capital Group. Would you like more information on how to get currencies in your portfolio? Schedule a meeting with us here