
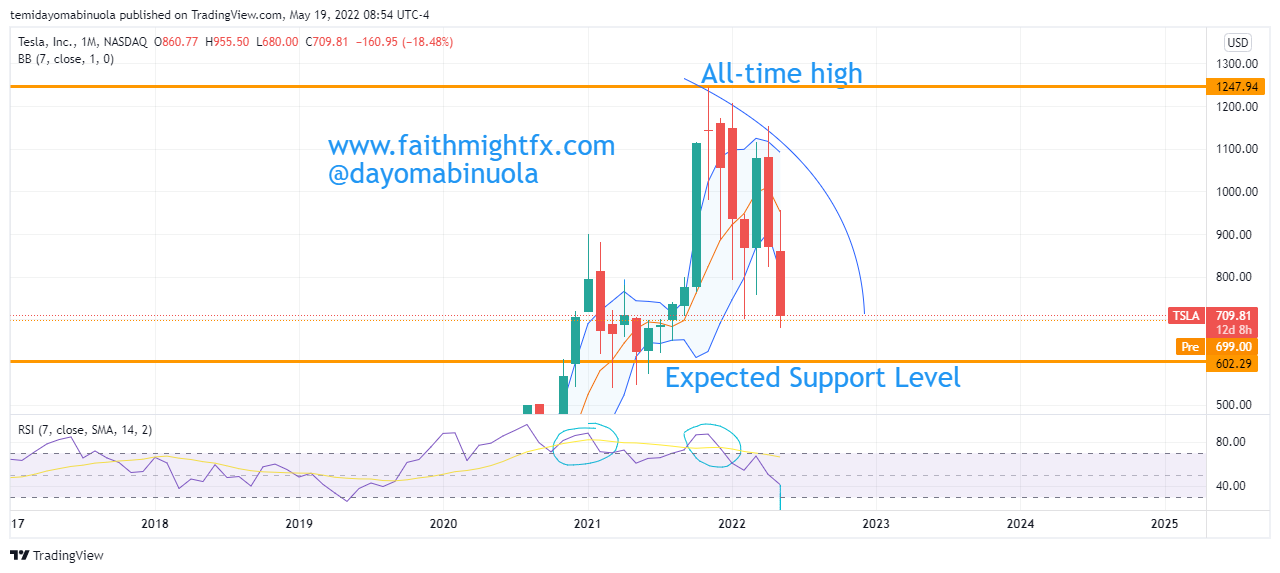
Since April 2020, the charts on Tesla have been bullish. This upward trend occurred in spite of the pandemic that crashed many stocks. The price at the beginning of the bull run in April 2020 was $100 per share after the stock split. (Please note that all prices are quoted since the stock split in August 2020). This continued until the end of the year despite little corrections in between. The $TSLA price soared on this bullish energy to an all-time high of $1,245 in November 2021.
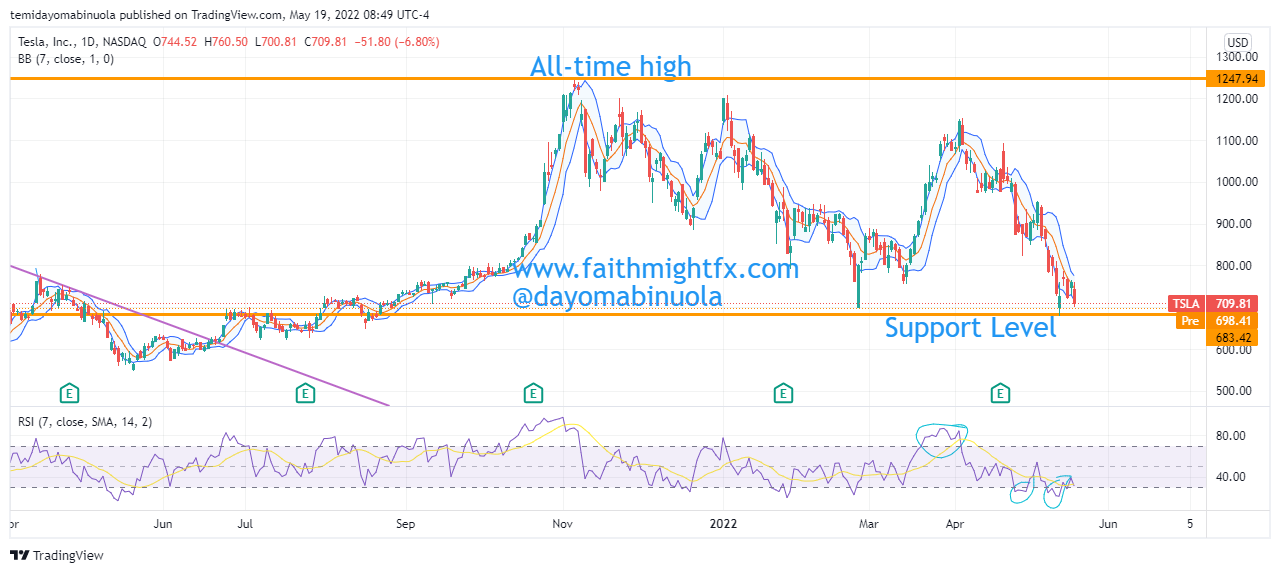
There has been a huge correction since the all-time high in November 2021 as price has been falling. This bearish run saw a little bullish movement which occurred in March 2022 with the price experiencing a temporary rally. The bulls, however, were counteracted by the bears and the price continued its downward trend. In Q4 2021, our analysts concluded that the share price of Tesla could go below $1000 after reaching a new high at $1092 in October 2021.
Tesla’s price is currently at $709.81 per share. The worst closing price on the monthly chart since May 2021 was $625. This bearish run might push the price down towards $600 per share. RSI has indicated that the price has been overbought on both the weekly and monthly charts since November 2021.
Some of these ideas are in our clients’ portfolios. To understand if this one can work for you or for help to invest your own wealth, talk to our advisors at FM Capital Group. Would you like more information on how to get stocks in your portfolio? Schedule a meeting with us here