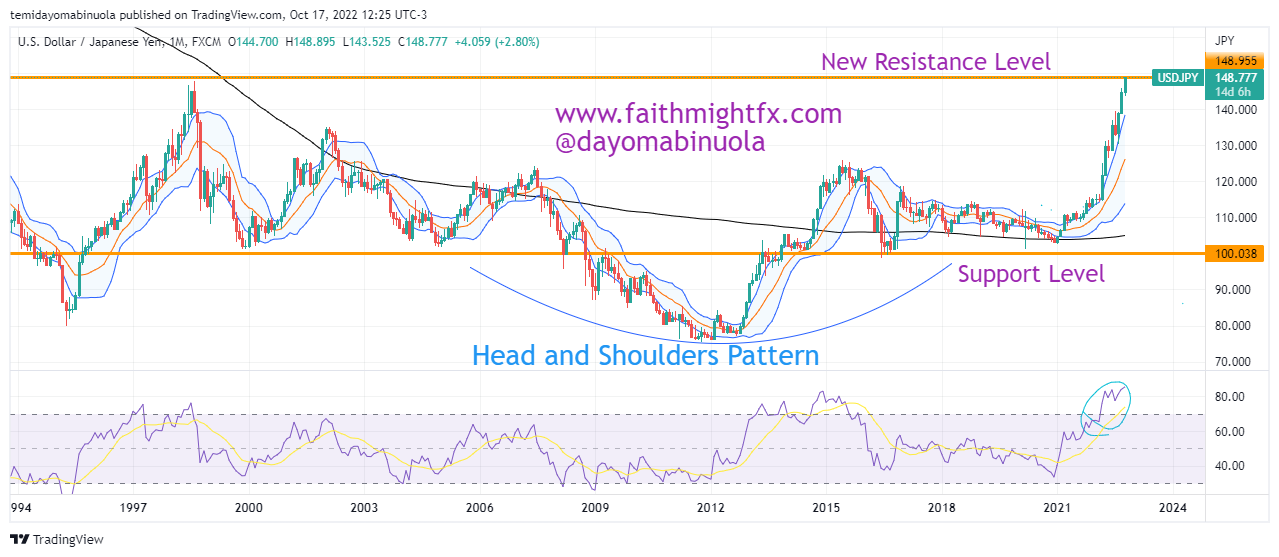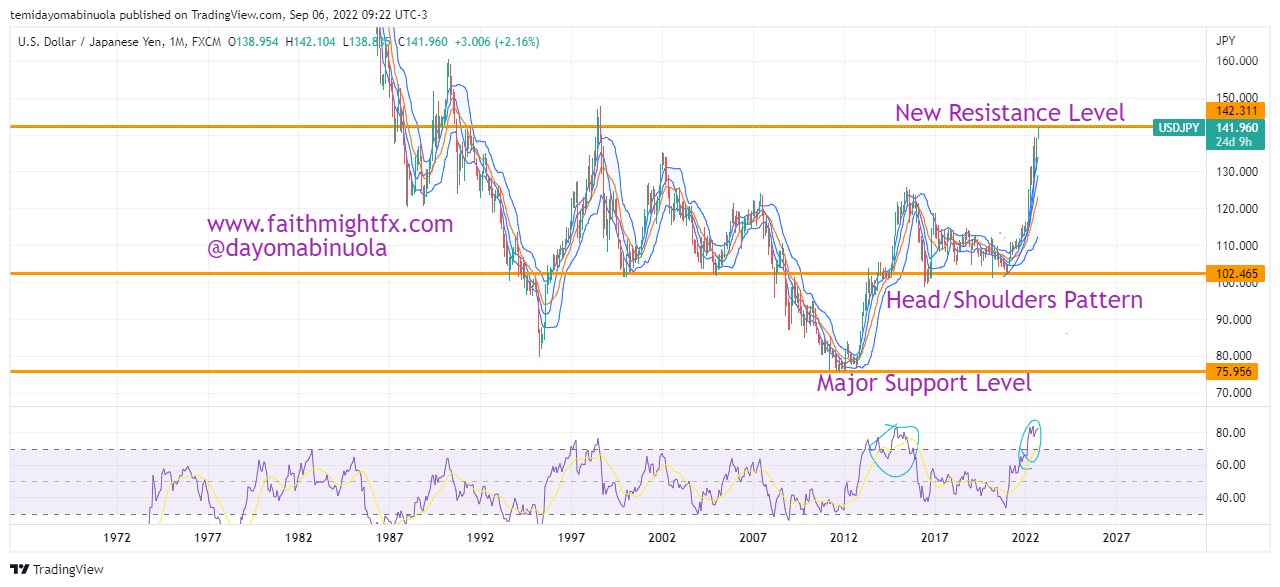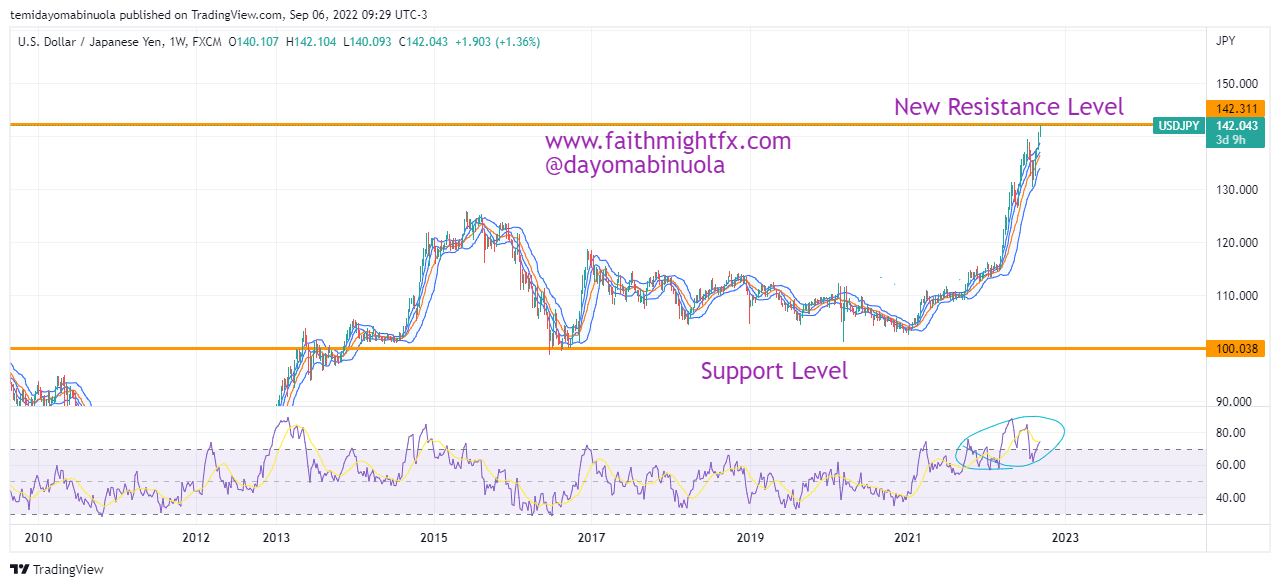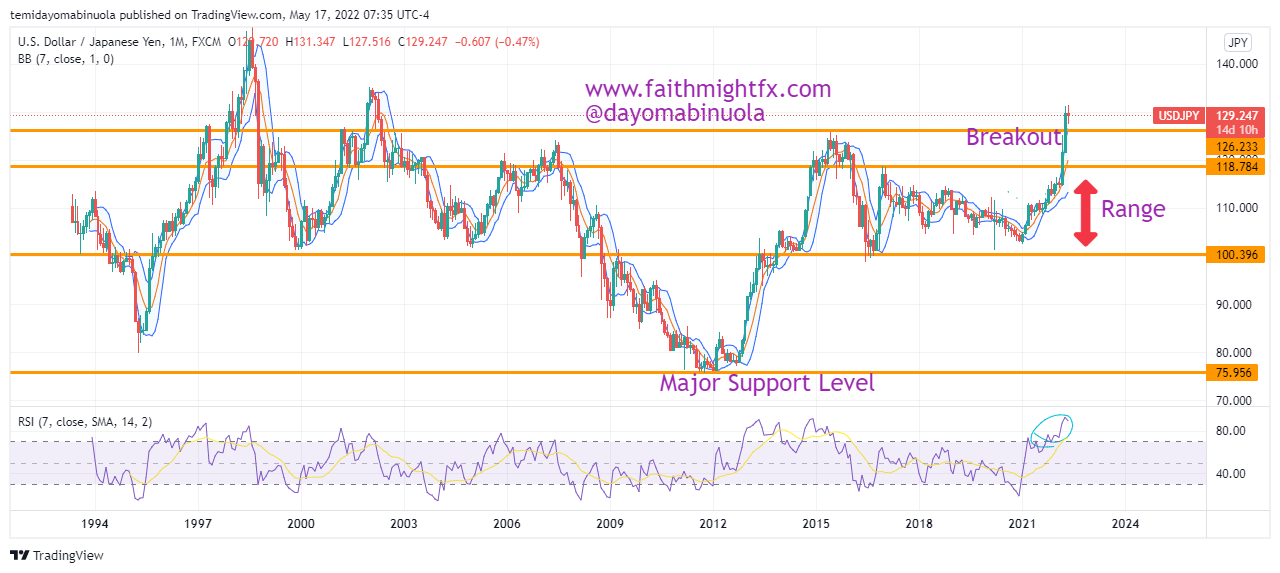
The Ninja popularly known as the USDJPY has been on a downward trend for the past 5 decades. Since the new millennium started, the Japanese Yen has gained more than the US Dollar. In the third quarter of the year 2011, the price of Ninja reached an all-time low at 75.784. From that all-time low in the third quarter of 2011, the US Dollar has been gaining against the yen. This rally has been sustained up until the 2024 high, which is a 112% gain in value, with the 2024 high at 161.923.
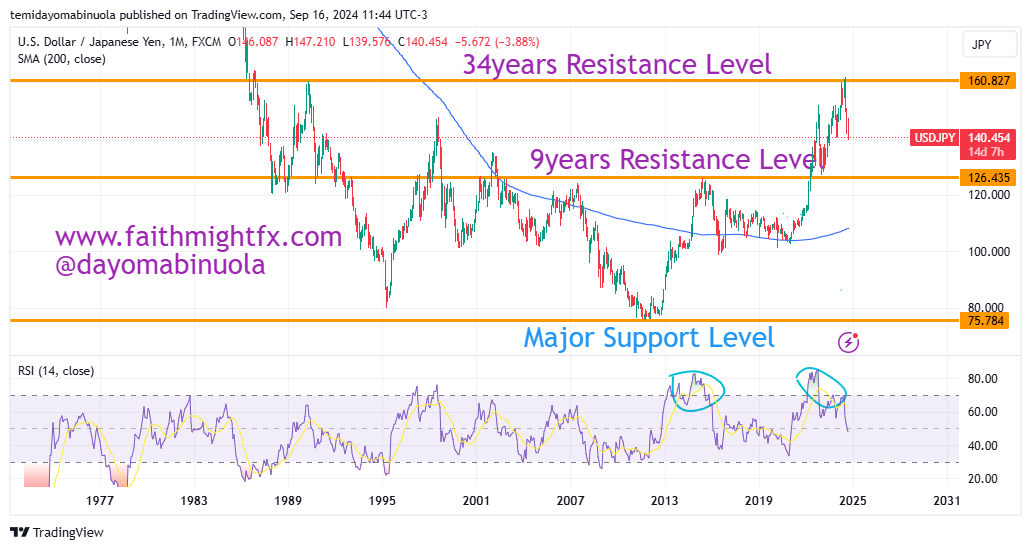
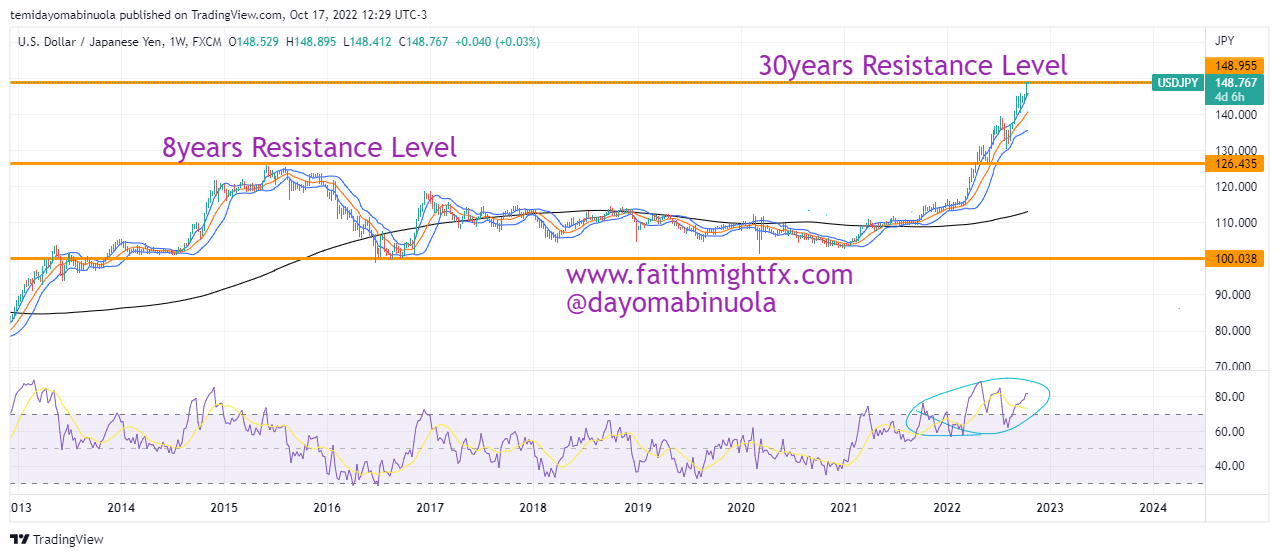
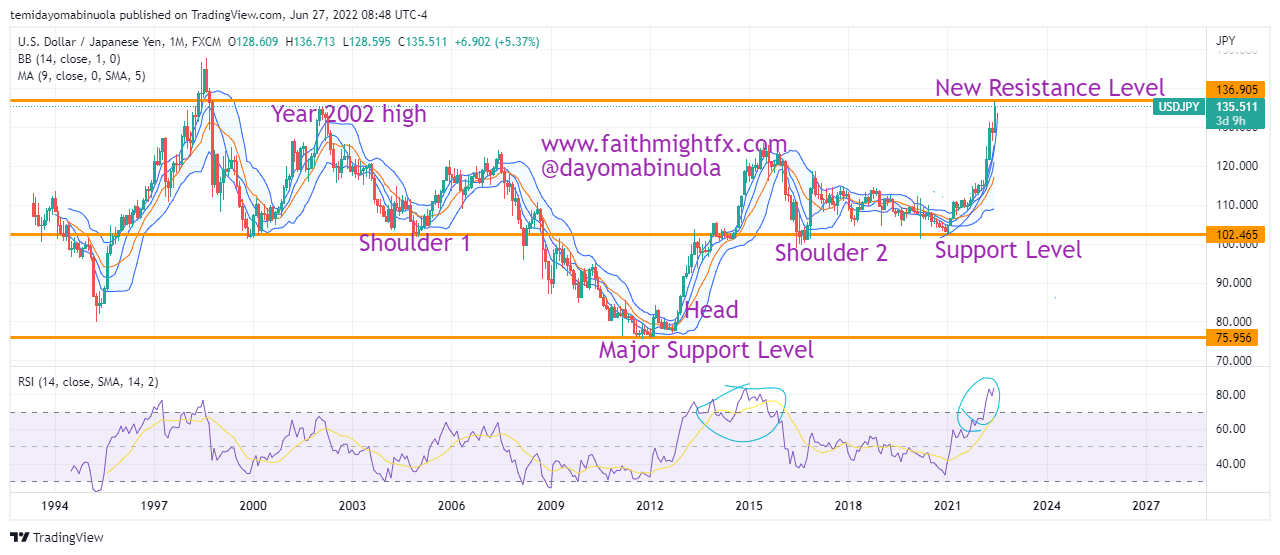
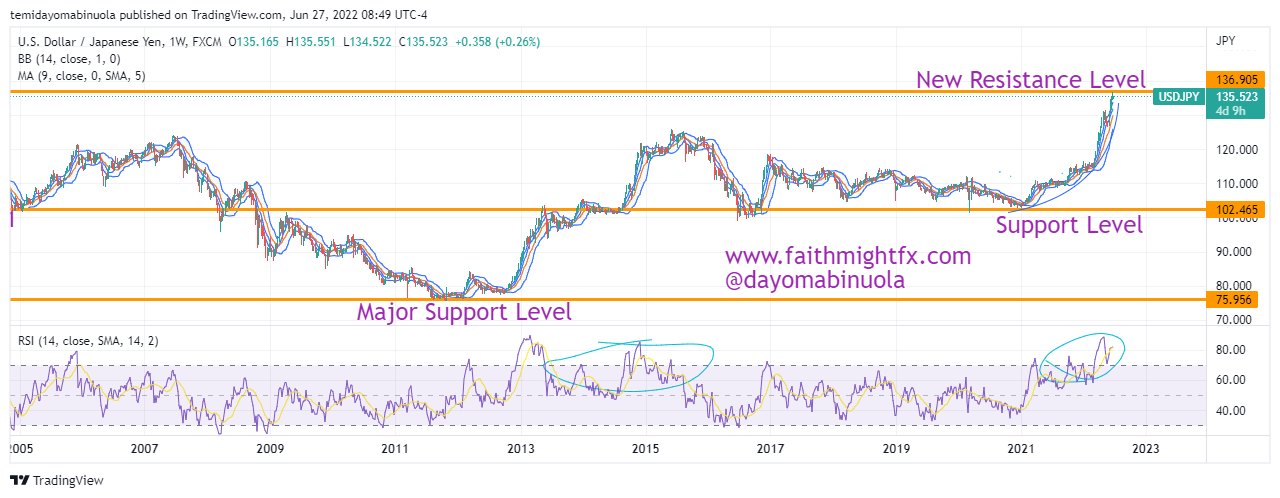
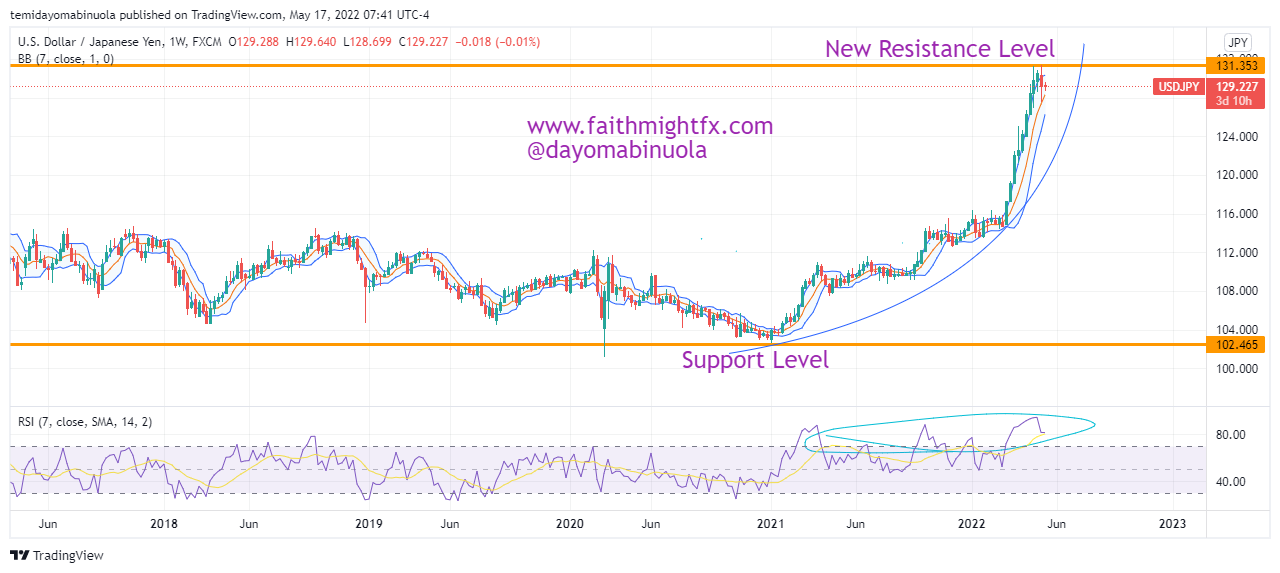
A 9-year resistance level of 126.435 was broken to the upside in April 2022 as a result of the above-mentioned rally. Also, a 34-year resistance level at 160.827 was broken to the upside as a result of this same powerful rally.
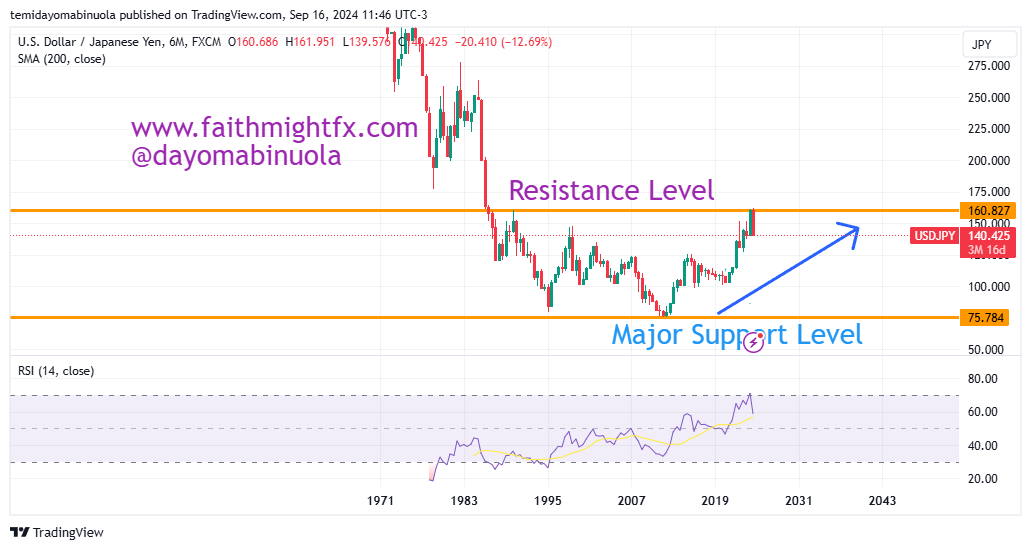
On the monthly chart, RSI has indicated that price has been overbought at two different times, namely the 2015 and 2022 resistance levels at 126.435 and 152.383 price-points respectively. The last two-month candlesticks closed bearish, but there are possibilities of price rallying to 146.784 in few weeks from the current price at 140.423 as at the time of this writing.
Some of these ideas are in our clients’ portfolios. To understand if this one can work for you or for help to invest your own wealth, talk to our advisors at FM Capital Group. Would you like more information on how to get currencies in your portfolio? Schedule a meeting with us here