fbpx

ON THE AIR with The Trader’s Vibe

Last month, I had the pleasure of speaking with a new traders community. Led by Carl Burgette, The Trader’s Vibe is a new weekly video podcast series where Carl interviews notable and prominent traders every week. To be considered notable and prominent in this business is truly an honor so I was happy to join him on the show. As with any new community, we spent much of the time talking about my background and how I entered into finance (which is a very unorthodox path, to say the least). Of course, we talked markets and what I was seeing at that time in the GBP. However, this was the first time that I was asked about how I’ve been treated as a woman in the business and my thoughts on bringing more women and people of color into finance.

Catch my episode of The Trader’s Vibe below. Enjoy!


If you are interested in learning how to read and analyze stock & forex charts on your own, please check out the CHARTS101 course. Read the charts for yourself so you can trade what you see and not what I think.

QUICK TAKE: S&P 500

After the March 2020 crash, the $SPX staged an impressive rally (along with other US indicies) that took price to new all-time highs. After a shallow correction in September, the $SPX managed to stage another rally. However, this rally failed to take out the new August highs. This was the first signal that a move lower could possibly be in the works.

SPX 4 HOUR CHART

The 3400 level on the $SPX was former resistance marking the former highs in February of this year. So after the break to new highs in September, investors needed to see the 3400 level hold, now, as support. Each break below this level has seen price dip into the green zone of support between 3330-3350 with a move lower into the 3200 support level.

Yesterday’s weak close below the 3400 level was a second clue that lower prices were in store. The first signal was the failed high after price recovered back above 3400 the day before. Today’s gap lower at the open should move the $SPX to 3200. As we move into more uncertainty (as explained in yesterday’s analysis of $GBPUSD), this will be the level to watch. A move lower still will cause investors to panic and the Federal Reserve to act again.

Because of the monetary stimulus and central bank activity in markets right now, I honestly did not think markets would move lower. So it is nice to see this development today as I am a firm believer in natural market forces being allowed to prevail, no matter the pain. I know lol. So I welcome today’s price action. Price can move lower still and it would still only be a healthy correction of the past 6-month rally and move price into those Fib levels. That remains to be seen.


If you are interested in learning how to do fundamental analysis and find levels in your trading, please check out the CHARTS101 course. Read the charts for yourself so you can trade what you see and not what I think.
Quick Take: GBP/USD

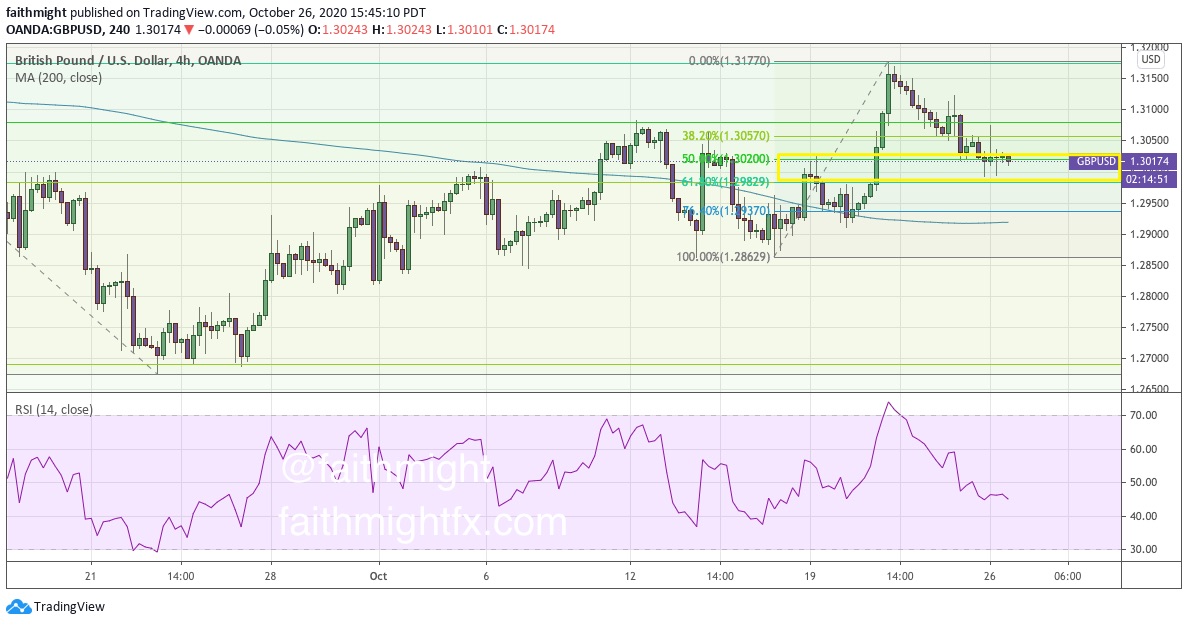
After some initial volatility to start the new trading week, the $GBPUSD has found support around the 50% Fibonacci level of the rally over the past 2 weeks. U.S. dollar weakness is starting to take hold as the market looks at all of the uncertainty brooding for the U.S. Between the election, the lack of a 2nd covid relief bill and the subtle breakouts of a coronavirus second wave across the country, the market has started to dump the safe haven currency.

GBPUSD 4-hour chart

It is important to note that the 1.30 major support level is just below that 50% Fibonacci level. That level is lending some extra support to $GBPUSD bulls. If cable can continue to hold above these 2 levels, it looks like this rally continues higher towards 1.3250.

However, the event risk to consider for this pair this week includes the release of US GDP, US personal spending & personal income and US consumer confidence. And, of course, Brexit headlines continue to spook markets as unscheduled surprise events.


If you are interested in learning how to do fundamental analysis and find levels in your trading, please check out the CHARTS101 course. Read the charts for yourself so you can trade what you see and not what I think.

Can Dollar Weakness Finally Trend?

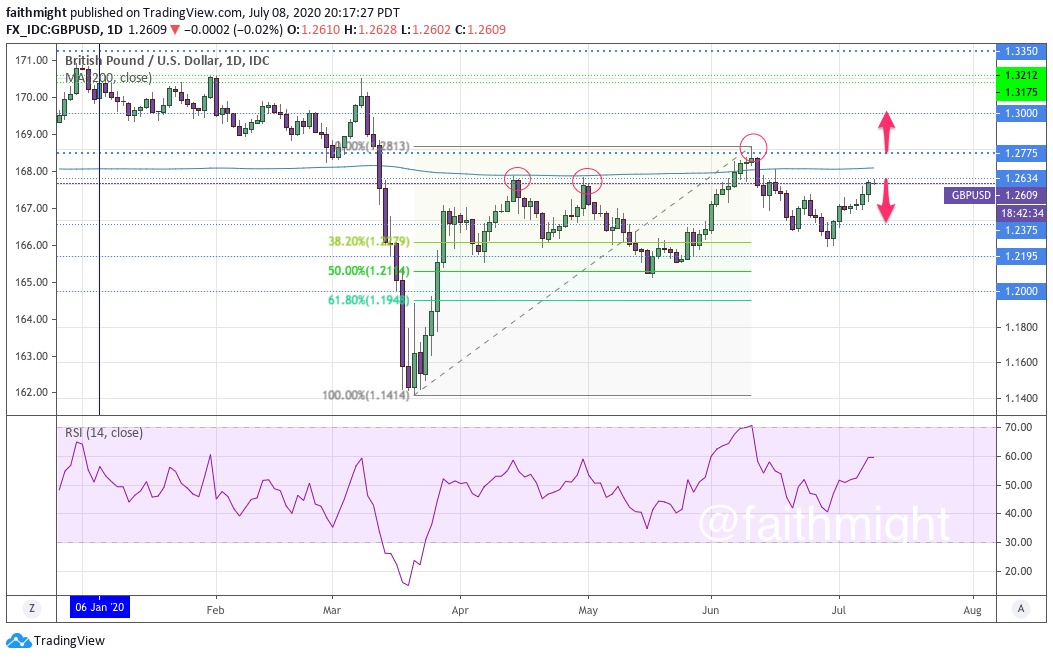
I have been harping on USD weakness for months now (here and here and here). Amazingly, during that time with poor U.S. economic data releases and stocks recovering, the USD has remained rangebound. Bouts of weakness have been met with strong bouts of buying since April. When looking at the $GBPUSD, the 1.2634 resistance level has remained that line in the sand for buyers and sellers. Until we get a break above 1.2634 that stays above the 1.2775 resistance level, we won’t see sustainable selloff in the USD.

GBPUSD DAILY CHART

Despite the jockeying between buyers and sellers, the $GBPUSD is trending higher with higher lows and higher highs. This indicates that the USD does continue to weaken more and more. A hold above the 1.2775 resistance level will see the $GBPUSD head towards the highs on the daily chart above the big 1.3000 level. However, another false break above 1.2634 could send $GBPUSD back into a correction that targets the 50% Fibonacci level at 1.2114 or lower.


If you are interested in learning how to find and use these levels in your trading, please check out the CHARTS101 course. Read the charts for yourself so you can trade what you see and not what I think.

Black Lives Matter Fuels New Interest in Stocks of Black Businesses

Given the demonstrations for justice and the humanity of Black lives, stocks of Black owned businesses have now caught the eyes of traders recently. I had a client turn my attention to Urban One ($UONE) a couple of weeks ago.

While I’m familiar with the company and its founder, Cathy Hughes, I didn’t know that it was publicly traded company. After spending some time doing the fundamental analysis, it is my opinion that the company is well managed and could get a lift in revenues with all this new consciousness coupled with the political ad buying season ramping up. Satisfied with my fundamental analysis, I took a look at the chart.

UONE DAILY CHART

While trading under $10 for nearly 14 years, the stock exploded to new 52-week highs on June 16th. Traders piled in not long after taking profits to push the stock to new all-time highs on June 19th – Juneteenth, naturally. Traders quickly took profits again at the $54.16 high. Despite breaking below the 61.8% Fibonacci retracement level, which signals a reversal back to lows, price still managed to settle above the $18.10 support level. As long as price can remain above support, $UONE can move higher. But a break below the $18.10 support level can see price quickly fall lower to the support zone at $10.21-11.25.

Now rumor has it that price could explode higher again tomorrow on July 7th. Why? July 7th is Blackout Day 2020.


If you are interested in learning how to do fundamental analysis and find levels in your trading, please check out the CHARTS101 course. Read the charts for yourself so you can trade what you see and not what I think.
How Do You Trade The Breakout Stock

$ETSY is on a tear. After dropping past its 2019 lows during the COVID-19 stock market crash, $ETSY has since skyrocketed to new all-time highs. Price broke above $100 for the first time ever last week. And hasn’t really looked back.

We’ve been buying $ETSY since it was trading in the teens. So the questions becomes how do you put new money to work in an asset that is experiencing such an incredible run up in its price like $ETSY has? The short answer is I wait.

I know that sounds strange but trading forex has hardened me. I just don’t chase price action. A correction always happens…in the forex market. That’s not necessarily the case in stocks. The trader in me can underestimate the effect of good (or poor) company management on stock prices. And Etsy is a very well-run company. Has been for years. Change your timeframe to long term then any price below $100 has been a good chance to buy.

If you already have a position, be patient and wait for Etsy to pay a dividend 🙂


If you are interested in learning how to find and use these levels in your trading, please check out the CHARTS101 course. Read the charts for yourself so you can trade what you see and not what I think.
ON THE AIR with Market Overtime with Nicole Petallides

I joined Market Overtime with Nicole Petallides to talk about the longer term trends presenting right now in the currency markets. This was my first time on the show. Weak GBP remains the prevailing theme in forex right now. Listen to hear why. Enjoy!


If you are interested in learning how to find and use these levels in your trading, please check out the CHARTS101 course. Read the charts for yourself so you can trade what you see and not what I think.
ON THE AIR with F.A.C.E.

Today, I spoke live with over 200 traders in the Forex Analytix Community Experience (F.A.C.E.) about what the opportunities are in GBP for the new trading week ahead. With multiple pairs ending the previous trading week at major support levels, there were several great opportunities to share with traders live in the market on camera. That’s always great. I hope everyone who caught me live is doing some trade management now on those trades. We have some great moves already in the $GBPUSD and $GBPJPY. In case you missed it, do study the replay below.


If you are interested in learning how to find and use these levels in your trading, please check out the CHARTS101 course. Read the charts for yourself so you can trade what you see and not what I think.

Is the Yen Telegraphing More Risk Ahead?

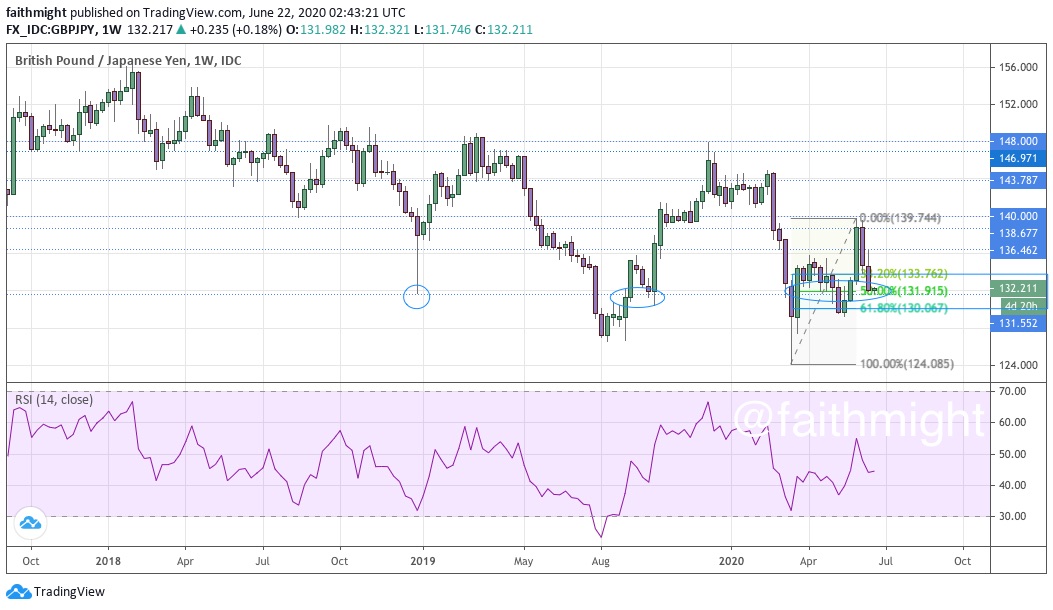
The $GBPJPY took a beating over the past 2 weeks since topping out at the major 140.00 resistance level. Last week, in particular, after a bounce off the Fibonacci levels, the $GBPJPY found sellers again, this time, at the 136.46 resistance level. Sellers pushed price lower from that resistance level to end last week at 131.73, just ahead of the 131.55 support level.

As the new trading week opens and gets underway, the $GBPJPY has remained above the 131.55 support level. But taking a look at the weekly chart, we see that the selloff last week has really just been a correction lower right into the 50% Fibonacci level at 131.95. If risk aversion subsides this week, the $GBPJPY could bottom here and begin to rally. A rally in the $GBPJPY could signal a rally in stocks as markets are willing to take on more risk aversion.

A move back above 140.00 targets the 123% Fibonacci extension at 143.34 which also finds confluence with the 143.78 resistance level. A move below 131.55, however, signals a move lower towards 124.00. And this would see stocks continue to languish and possibly accelerate lower. Keep your eyes on yen!


If you are interested in learning how to find and use these levels in your trading, please check out the CHARTS101 course. Read the charts for yourself so you can trade what you see and not what I think.

What’s Going on With the U.S. Dollar

With everything the Fed has done to loosen monetary policy, the USD should be far lower. But the reserve currency is in high demand during this time of disease and civil unrest. Though it will be a back and forth, tug of war, I still believe that the USD weakens in the face of unprecedented expansion of the Federal Reserve balance sheet.

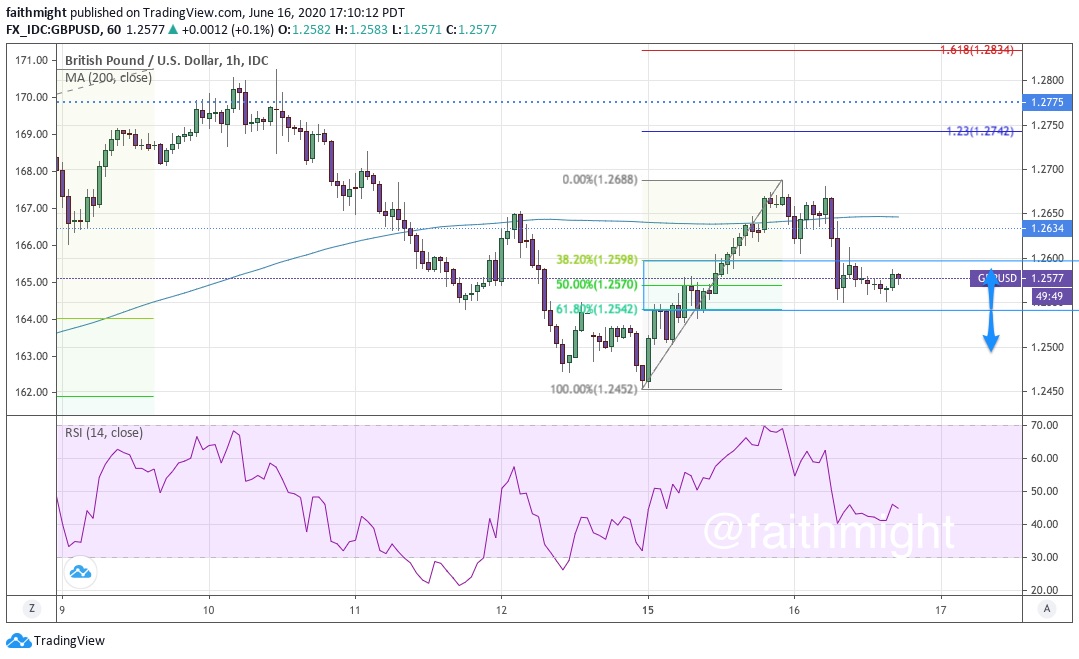
GBPUSD 1 HOUR CHART, JUNE 16

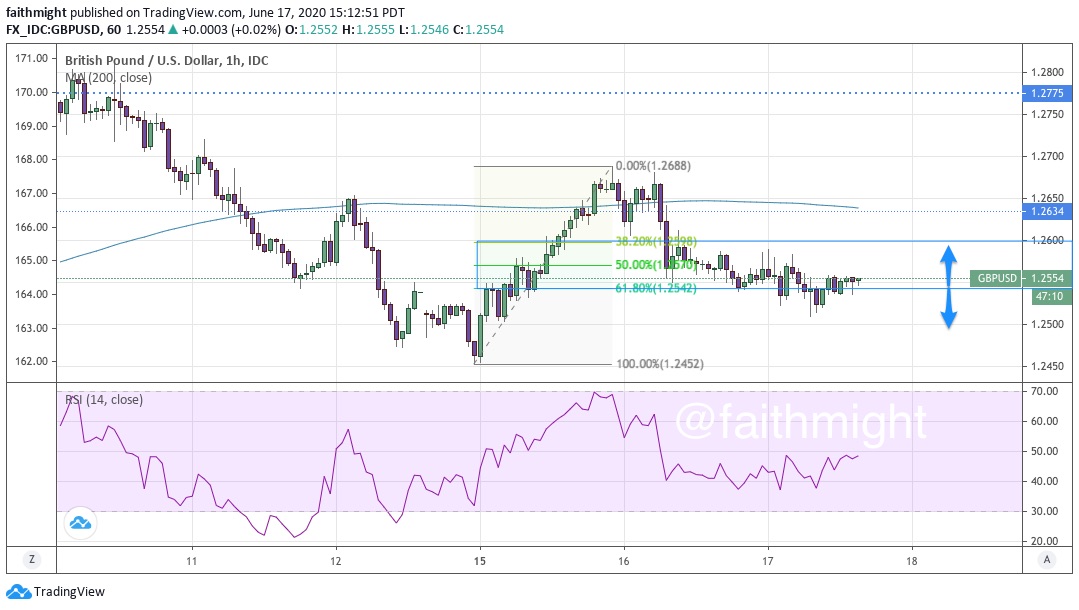
This is a short-term view of Tuesday’s price action in the $GBPUSD. After bottoming below the 1.25 level, cable managed to rally over 200 pips before topping out at 1.2688. Upon Powell’s testimony during the U.S. session, the USD rallied as traders dialed down their risk appetite with price finding support in the Fibonacci levels.

Well, this is where $GBPUSD stands just a day later:

GBPUSD 1 HOUR CHART, JUNE 17

The break below the 61.8% Fibonacci retracement level is a signal for a move lower. But that will be highly dependent on how the market reacts to the Bank of England monetary policy decision tomorrow morning.


If you are interested in learning how to find and use these levels in your trading, please check out the CHARTS101 course. Read the charts for yourself so you can trade what you see and not what I think.