The $GBPJPY took a beating over the past 2 weeks since topping out at the major 140.00 resistance level. Last week, in particular, after a bounce off the Fibonacci levels, the $GBPJPY found sellers again, this time, at the 136.46 resistance level. Sellers pushed price lower from that resistance level to end last week at 131.73, just ahead of the 131.55 support level.
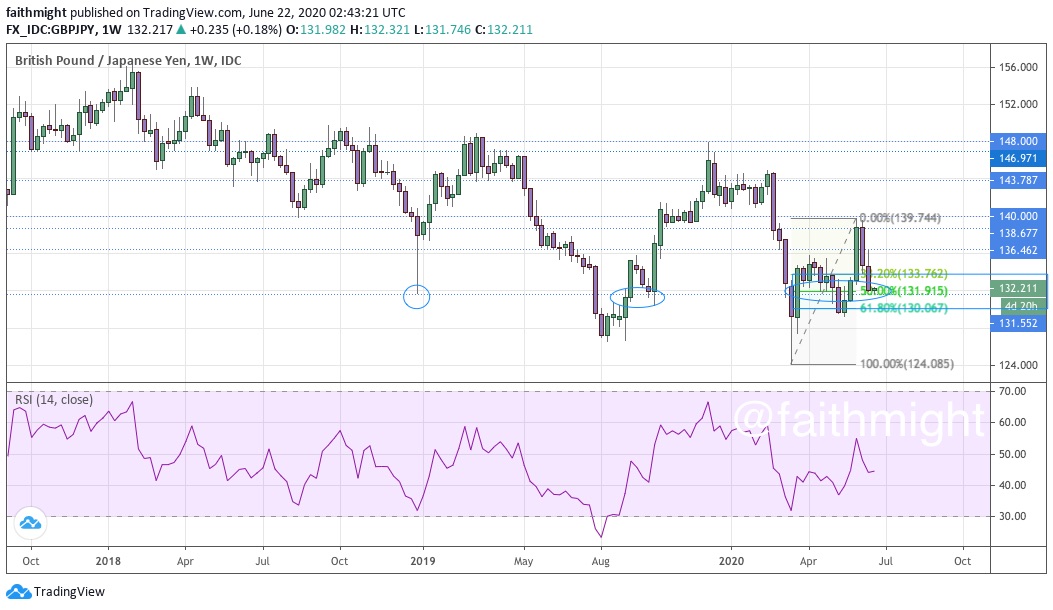
As the new trading week opens and gets underway, the $GBPJPY has remained above the 131.55 support level. But taking a look at the weekly chart, we see that the selloff last week has really just been a correction lower right into the 50% Fibonacci level at 131.95. If risk aversion subsides this week, the $GBPJPY could bottom here and begin to rally. A rally in the $GBPJPY could signal a rally in stocks as markets are willing to take on more risk aversion.
A move back above 140.00 targets the 123% Fibonacci extension at 143.34 which also finds confluence with the 143.78 resistance level. A move below 131.55, however, signals a move lower towards 124.00. And this would see stocks continue to languish and possibly accelerate lower. Keep your eyes on yen!
If you are interested in learning how to find and use these levels in your trading, please check out the CHARTS101 course. Read the charts for yourself so you can trade what you see and not what I think.