Author: @dayomabinuola

  • Loss in NFT Value Might Just Be Short-Term

    Loss in NFT Value Might Just Be Short-Term

    Non-Fungible Token, NFT for shorts, is a unique digital identifier that cannot be copied, substituted, or subdivided, recorded in a blockchain, and used to certify authenticity and ownership. The ownership of an NFT is recorded in the blockchain and can be transferred by the owner, allowing NFTs to be sold and traded. NFTs can be created by anybody and require few or no coding skills to create. The Non-Fungible Token (NFT) market nosedived from its peak of $17 billion in early 2022 to $470 million in September 2022. That is about 97% drop in value. This data was compiled by Dune Analytics, a blockchain analytics firm.

    Ethereum Monthly Chart

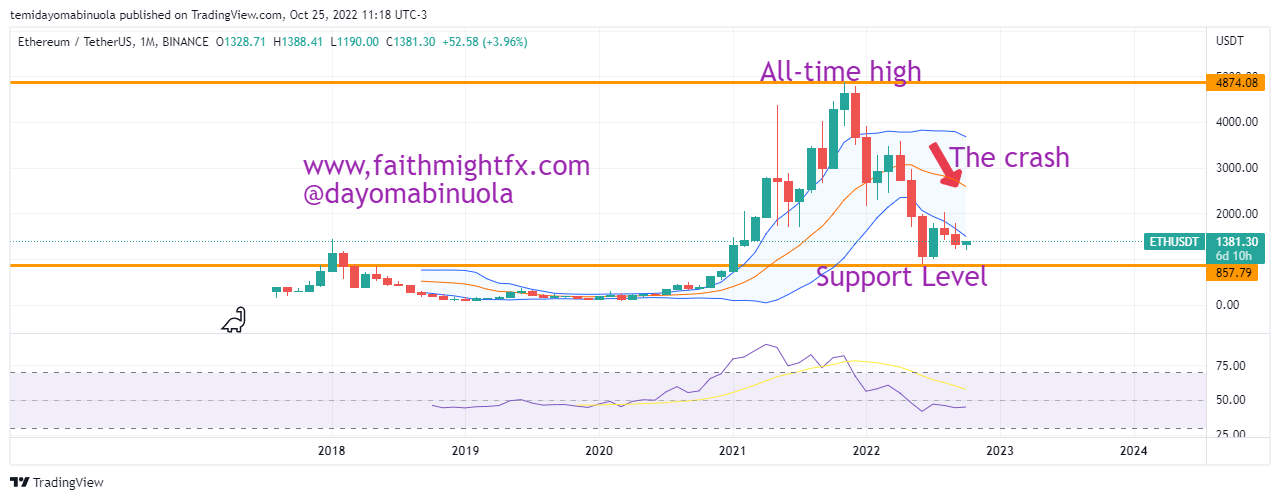
    The growth of NFT between 2020 and 2021 cannot be overlooked as the market grew by 21,000%. i.e. from $82million to more than $17 billion. Ethereum is one of the commonly used blockchain networks to trade NFTs.  In the next few years as crypto assets appreciate, there will be increment in the value of NFTs and the $17billion value might be surpassed as a result of the next crypto rally.

    Flow Monthly Chat

    Some of these ideas are in our clients’ portfolios. To understand if this one can work for you or for help to invest your own wealth, talk to our advisors at FM Capital Group. Would you like more information on how to get crypto and Nfts in your portfolio? Schedule a meeting with us here

  • Bitcoin Bears To Stay Dominant

    Bitcoin Bears To Stay Dominant

    Since the all-time high for Bitcoin has been reached in November 2021, Bitcoin price has dipped heavily. BTCUSD has lost 72.1% of its value from the all-time high at $69,149. As of today, 25th of October 2022, price is around $19,292. The Bitcoin resistance level for the year was at $48,239, which was on the 28th of March 2022. Bitcoin had the highest market capitalization of $1.28 trillion on November 9, 2021. 8 years ago, precisely on May 1, 2013, Bitcoin’s market capitalization was at $1.2 billion. There has been a monumental growth in the value since its launch in 2009 when price was at $0.0009.

    Daily Chart

    Just like the Bitcoin crash, most crypto assets have fallen in value. Many crypto investors are hopeful that price would appreciate before the end of the year. There are no signs or possible indications that price could rally this year. All through this year, each time the price of Bitcoin has tried to appreciate, it has been consistently counteracted by a bearish force. The year’s support level is at $17,775 which was reached in June 2022. Using the Monthly Chart, price is currently consolidating around the 2017 resistance level at $17,500. The Daily Chart has shown more of a ranging price for the most part of October 2022. We might be seeing price fall below the year’s low at $17,775, which will further reduce the value of BTC; keep in mind that the current market cap of Bitcoin is at $370.5 billion.

    Monthly Chart

    Some of these ideas are in our clients’ portfolios. To understand if this one can work for you or for help to invest your own wealth, talk to our advisors at FM Capital Group. Would you like more information on how to get cryptocurrencies in your portfolio? Schedule a meeting with us here

  • Carnival Corporation Share Price Bounces from Support Level

    Carnival Corporation Share Price Bounces from Support Level

    Carnival corporation &plc is a British-American cruise operator with a combined fleet of over 100 vessels across 10 cruise line brands. Carnival corporation had its IPO in July 1987 at $3.94 per share. Carnival corporation is listed on NYSE and LSE. As of this year, the total staff of Carnival corporation stands at 150,000.

    Daily Chart

    Carnival corporation & plc announces offering of $1.25 Billion for refinancing to be issued by Carnival Holdings in Bermuda. This news could have been the reason for an uprise in the price of Carnival yesterday, with 11.14% appreciation in price.

    Weekly Chart

    Over the years as price rallied, $CCL reach an all-time high in January 2018 at $72.85 and fell to $8.08 as a result of the 2020 pandemic. Post-Lockdown, a rally to $31.83 occurred in 2021, which currently stands as a a two-year high. Before the 11.14% rally yesterday, the price of $CCL fell to $5.89, which makes it the lowest price since 1991. We might be seeing a rally to $11 in the coming weeks from its current price at $8.08.

    Some of these ideas are in our clients’ portfolios. To understand if this one can work for you or for help to invest your own wealth, talk to our advisors at FM Capital Group. Would you like more information on how to get stocks in your portfolio? Schedule a meeting with us here

  • Gold’s Price Heading To 2022 Support Level

    Gold’s Price Heading To 2022 Support Level

    Globally, the prices of commodities have dipped this year. At the beginning of the year, the price of Gold was at $1829 per ounce. There was a rally in the first quarter of the year, which made price reach $2071 per ounce. Since the year’s high was reached, it has continued to fall. We wrote an article in July 19, when price of Gold was at $1711. Our analysts on this day said price could fall below the then support level of $1676. The price of Gold today stands at $1632.

    Daily Chart

    Just like the cryptocurrency market is down in this year, the gold market is also down. We might be seeing a new 2022 low below $1616, which is the current year’s low. On the weekly chart, there is a double-top pattern, which must have led to price fall. Despite RSI shows price has been oversold twice on the daily chart, price could still fall further.

    Weekly Chart

    Some of these ideas are in our clients’ portfolios. To understand if this one can work for you or for help to invest your own wealth, talk to our advisors at FM Capital Group. Would you like more information on how to get commodities in your portfolio? Schedule a meeting with us here

  • Bulls Get Set for Coinbase

    Bulls Get Set for Coinbase

    Since Coinbase share price dipped from the all-time high at $430 which was reached in the month of its IPO, each time the bulls make efforts to rally the price, the bears counteract it. All monthly candlesticks since its IPO have closed below the IPO price.

    Daily Chart

    There was a bounce from the all-time low at $39.25 in May 2021. The current price of $COIN is at $66.21. The second half of the year has been characterized by a range. Price has been ranging between $46 and $116.72, with $116.72 being the current resistance level on the monthly time frame. We might be seeing price reach $100 before the end of the year as Google sets to partner with Coinbase.

    Weekly Chart

    Some of these ideas are in our clients’ portfolios. To understand if this one can work for you or for help to invest your own wealth, talk to our advisors at FM Capital Group. Would you like more information on how to get crypto-curencies in your portfolio? Schedule a meeting with us here

  • Archaea Energy Gains Over 50% In One Day

    Archaea Energy Gains Over 50% In One Day

    Archaea Energy is one of the largest renewable natural gas producers in the United States with an industry leading RNG platform and expertise in developing, constructing and operating RNG facilities to capture waste emissions and convert them into low-carbon fuel. 

    Monthly Chart

    Archaea Energy had its IPO in December 2020 at $11.50 per share. The first four months of its IPO closed bearish until the bulls took over at the beginning of the second quarter in 2021 as price reached a new high in June 2021 at $18.61. The highest point Archaea’s share price reached in 2021 was $21.95 and the closing price for the year was $18.28.

    The first four months of 2022 was majorly bullish as Archaea Energy attained a new high at $23.75 in April 2022. The following month was followed by a bearish turn which resulted in price reaching a current year’s low at $12.62 in June 2022. A rally then commenced from the year’s low to an all-time high of $26.12 on October 17, 2022 which was as a result of a gap up.

    Weekly Chart

    This gap up is the result of a recent announcement by British Petroleum of its plans to expand into bioenergy by acquiring Archaea Energy for approximately $4.1Billion. The gap up led to a 54.15% appreciation in Archaea Energy’s share price which is the highest rally in a single day since its IPO. As a result of the rally, RSI is currently overbought on the daily chart which might lead to a correction in price and this correction might reach $24.

    Some of these ideas are in our clients’ portfolios. To understand if this one can work for you or for help to invest your own wealth, talk to our advisors at FM Capital Group. Would you like more information on how to get stocks in your portfolio? Schedule a meeting with us here

  • Cloudflare Stock Appreciates By 13%

    Cloudflare Stock Appreciates By 13%

    Since the crash of Cloudflare’s share price from the all-time high at $221.53 in November 2021, the price has failed to rally. Each time it attempts a rally, it is counteracted by a more aggressive bearish force. 

    Daily Chart

    All Cloudflare investors since January 2021 are currently at a loss. The current price of Cloudflare’s share is $51.72 while the current low for the year 2022 is at $40.03. Despite the crash in price, Cloudflare is still trading above its IPO which is $18.

    Monthly Chart

    On October 17, 2022, Cloudflare’s share price saw a 13% gain. Despite this recent rally, the bears might push price to a new year’s low.

    Some of these ideas are in our clients’ portfolios. To understand if this one can work for you or for help to invest your own wealth, talk to our advisors at FM Capital Group. Would you like more information on how to get stocks in your portfolio? Schedule a meeting with us here

  • EURGBP To Lose Bull Pressure

    EURGBP To Lose Bull Pressure

    The first half resistance for the year was at 0.87265, which was in June 2022. There was a break-out to the upside in September has price rallied to 0.92758 in September 2022, which is this year’s high. After the rally to 0.92758 on the 26th of September 2022, the next trading day closed bearish which has led to more bearish close. The bulls tried to push price high to 0.88188 in October after a price fall to 0.86495.

    Monthly Chart

    The last 2 trading days have closed with a doji. The price might also close with a doji today, which could be an indication of price reversal to the downside. If the price falls, the support level at 0.86495 might be broken to the downside. The Daily Chart shows the RSI has been overbought, which the daily candlesticks indicate a possible price reversal in the coming days.

    Daily Chart

    Some of these ideas are in our clients’ portfolios. To understand if this one can work for you or for help to invest your own wealth, talk to our advisors at FM Capital Group. Would you like more information on how to get currencies in your portfolio? Schedule a meeting with us here

  • Dow Jones Falls Below 30,000 For The Second Time In 2022

    Dow Jones Falls Below 30,000 For The Second Time In 2022

    The Dow Jones Index is a combination of 30 stocks that reflects the US economy and the stock market as a whole. Looking at the history of the Dow Jones when it was first launched in May 1896, which is over a century ago, the IPO price was at $29. In over one century it has been listed on the stock exchange, the $DJIA has appreciated to a ground-breaking $36,991, making it the all-time high. Since its IPO in the year 1896, $DJIA has appreciated over 1270% to reach the all-time high. The threshold was reached in January 2022.

    Monthly Chart

    The Stock Index has not been good for investments this year as it has been majorly bearish. In the first half of the year, in June to be precise, the price of $DJIA went as low as 29,698. The bulls made price rally above $34,000 in August 2022. The rally was countered with the bears’ activities, making the price fall to a new low in 2022 at $28,969. Since the all-time high, price has been overbought on the RSI using the monthly chart. The monthly candlesticks have since April 2022 been closing in the lower region of the Bollinger Bands. In the coming weeks, we might see price rally above $30,000 again.

    Daily Chart

    Some of these ideas are in our clients’ portfolios. To understand if this one can work for you or for help to invest your own wealth, talk to our advisors at FM Capital Group. Would you like more information on how to get stock indices in your portfolio? Schedule a meeting with us here

  • EURCHF Reaches All-Time Low

    EURCHF Reaches All-Time Low

    The opening price of $EURCHF this year was at 1.0376. Euro gained against the Swiss Franc for just a few weeks. This rally reached 1.06123, which is the current 2022 high. Most of the monthly candlesticks in 2022 have closed bearish, which shows the strength of the Swiss Franc.

    Daily Chart

    On the weekly chart between the year 2015 and 2021, a head and shoulders was formed, which led to the price fall from May 2021 to the current price below $1. The current price of $EURCHF is at 0.95485 after reaching the lowest price level at 0.94062. The Swiss Franc has been appreciating against the Euro since 1973. Each time a rally occurs, it is countered with an aggressive bearish take over. There are indications that price could rally in the coming weeks. The rally could push price to 1.02223.

    Weekly Chart

    Some of these ideas are in our clients’ portfolios. To understand if this one can work for you or for help to invest your own wealth, talk to our advisors at FM Capital Group. Would you like more information on how to get currencies in your portfolio? Schedule a meeting with us here