For the second time in two years, Musk’s Tesla has split its stocks. The stock is to split by 3 for 1 and was to take effect at the close of yesterday’s trading day, 24th of August, 2022. Due to the split, the share price of Tesla closed at $302 per share.
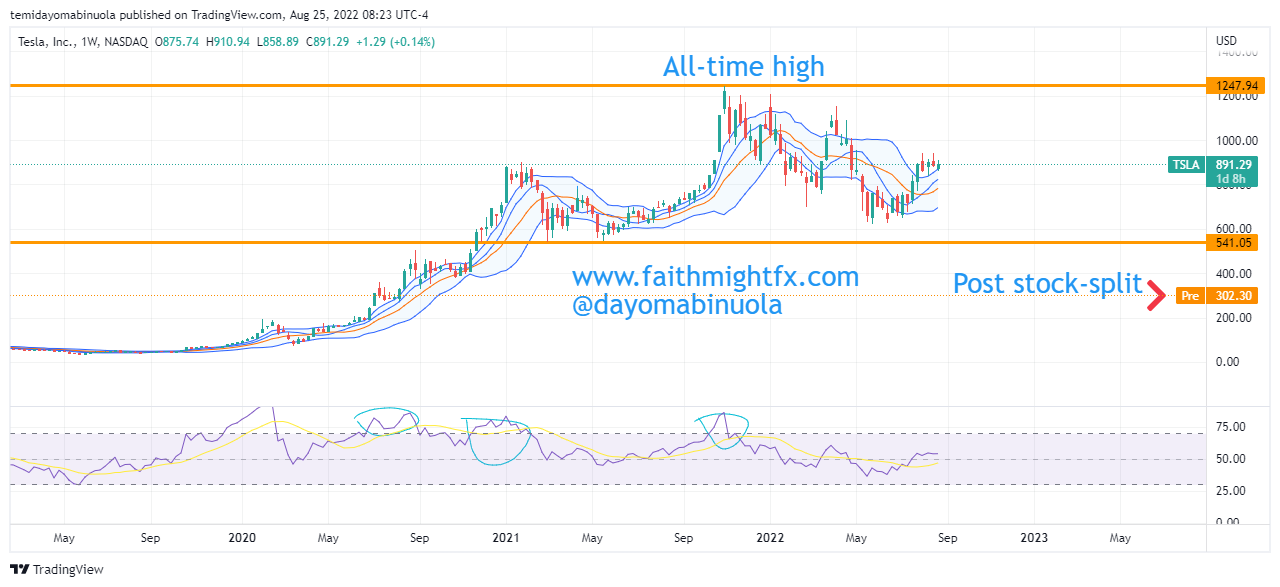
On the 19th of May 2022, we published an article where we made a forecast that Tesla’s share price will fall to $600. As of the time of publishing the article, Tesla’s share price was $709. Immediately after our forecast, Tesla’s share price dropped to $620 after which it began to rally. We are correct to say that our forecast reached its mark only that this 3:1 split has disrupted the price as Tesla is now trading at $300 per share.
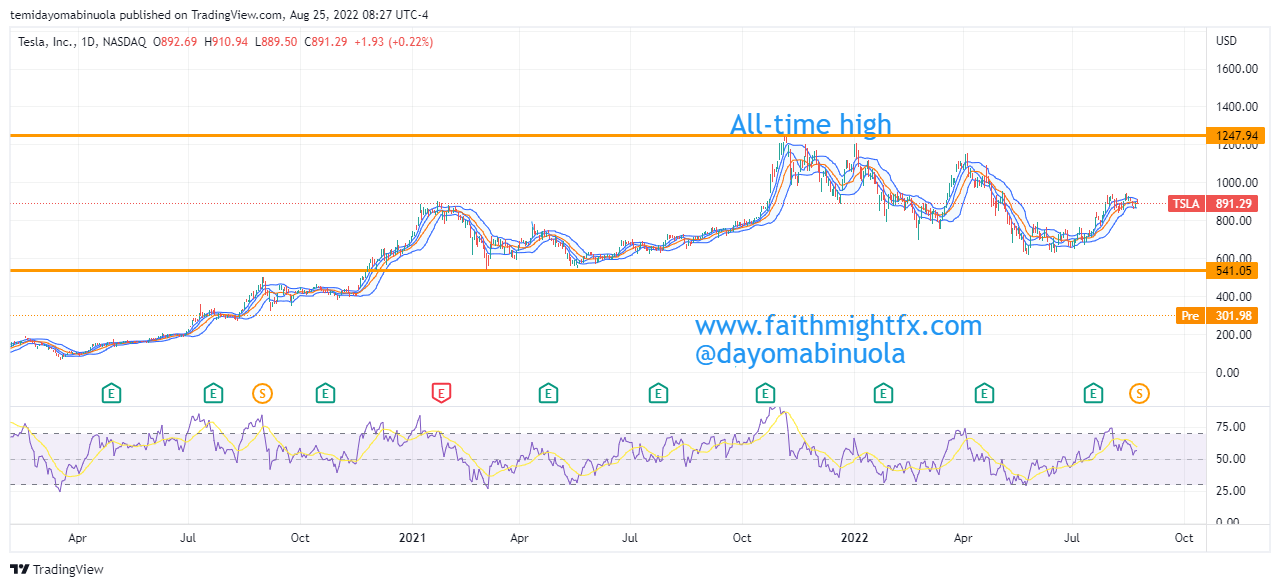
According to our analysis, following this stock split, Tesla’s share price might range around $300 psychological level for the next few months. This means that we don’t see Tesla’s share price reaching $400 this year.
Some of these ideas are in our clients’ portfolios. To understand if this one can work for you or for help to invest your own wealth, talk to our advisors at FM Capital Group. Would you like more information on how to get stocks in your portfolio? Schedule a meeting with us here