Snapchat had its IPO in March 2017 at $24. The first two trading days closed with the bulls in charge. The third trading day had the bears gaining traction and this traction transitioned into a full-blown bearish run up until December 2018. In that month of December 2018, Snapchat share price hit $4.88, which stands as the all-time low.
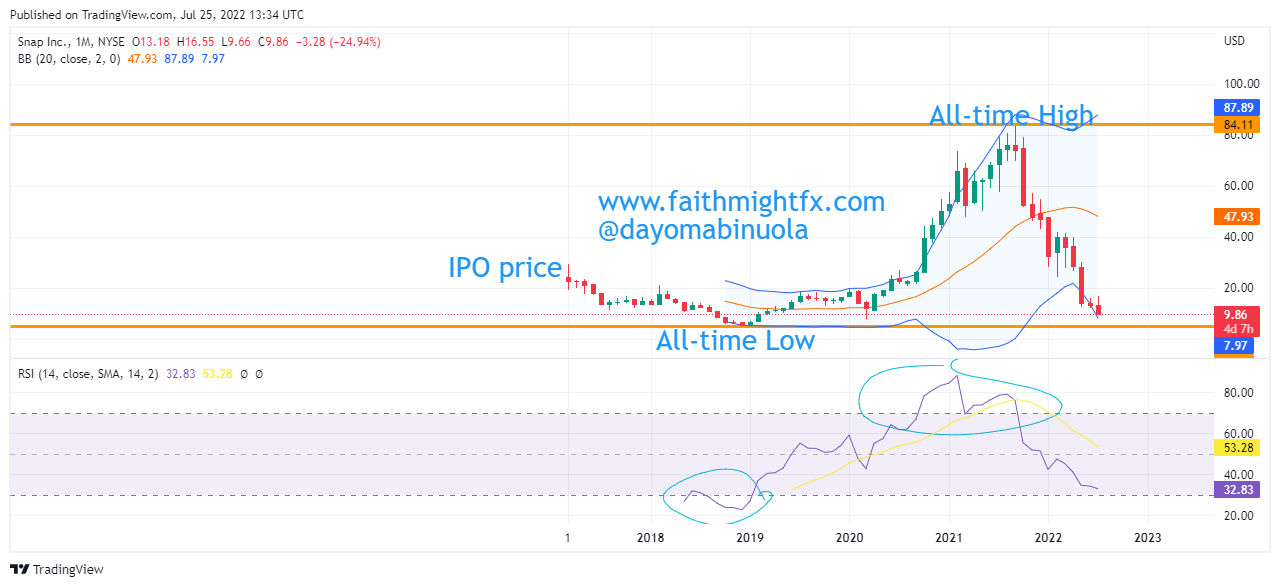
2019 began on a brighter note in comparison to the previous year as the first seven months of 2019 closed bullish. This bull trend couldn’t complete a year-long run as price ranged between $12 and $18. A few months into 2020, precisely in April, the bulls became active while price was about $11. On the monthly chart, a bullish steam picked up and it raved on until Snapchat’s share price hit $83, which stands as the all-time high. This all-time high was reached in September 2021.
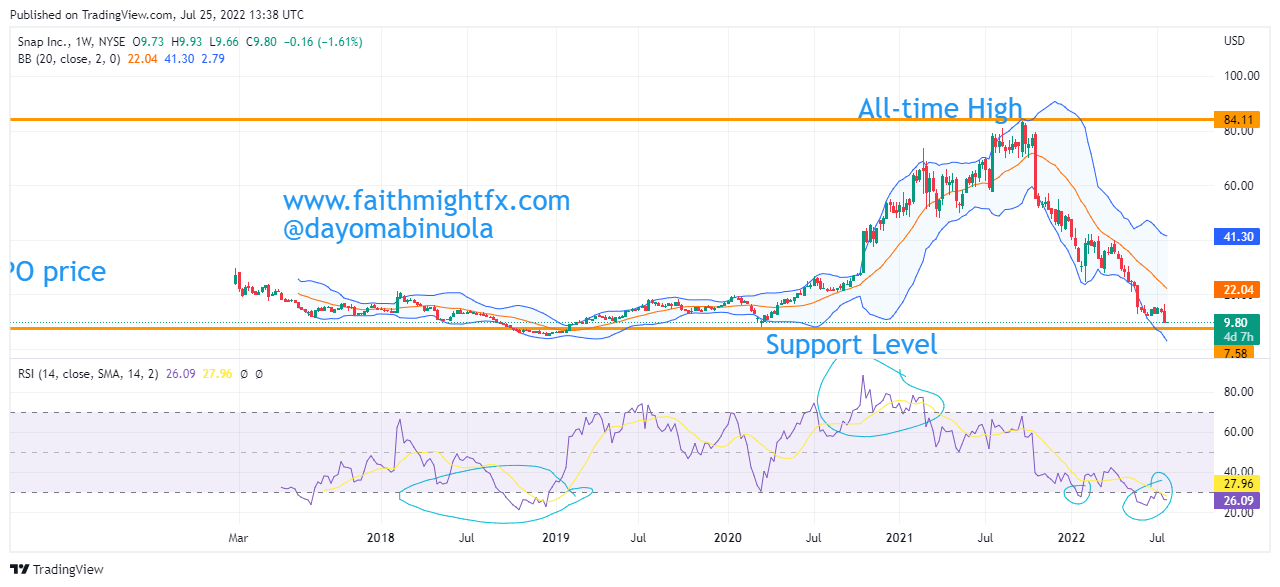
Ever since this all-time high was hit, Snapchat’s share price has been falling heavily. Since September 2021 till date, all monthly candlesticks have closed bearish except for February 2022. So far, Snapchat has lost over 87% of its all-time high. Since May 24 2022, the price of Snapchat has been ranging between $11 and $15.
On the 22nd of July, 2022, a gap down occurred that resulted in a 39% loss in value as price fell from $16 to $9.97. The last time price got to this level was in March 2020 during the lockdown. In the next few weeks, we could see price rallying above $20 as price is currently oversold on the RSI.
Some of these ideas are in our clients’ portfolios. To understand if this one can work for you or for help to invest your own wealth, talk to our advisors at FM Capital Group. Would you like more information on how to get stocks in your portfolio? Schedule a meeting with us here