Author: @dayomabinuola

  • Gold Price Reaches A New 2022 Low

    Gold Price Reaches A New 2022 Low

    Gold opened in 2022 at $1830 per ounce and for the first part of the month, it was bullish. But then it changed direction and began to fall until it eventually closed on a bearish candlestick at $1796. As February 2022 began, the bulls got their groove back and were dominant for the next couple of weeks which caused February and March 2022 to both close with bullish candlesticks.

    Weekly Chart

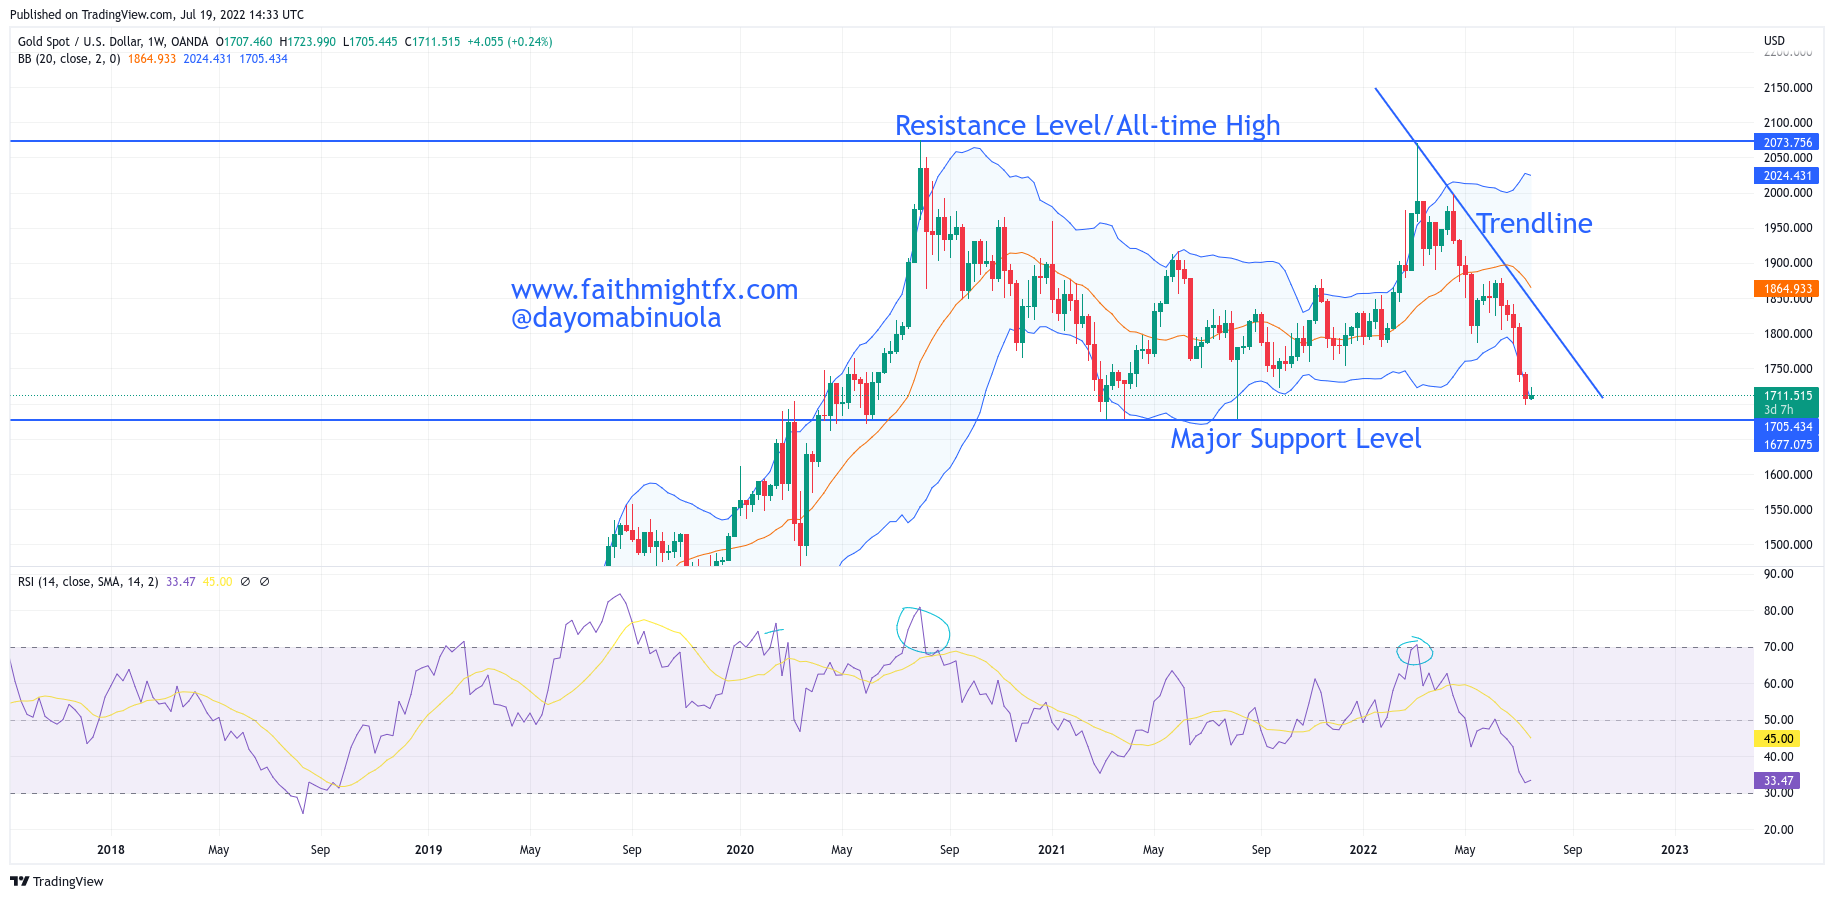
    Gold price movements in 2021 was more of a range between $1907 and $1705 on the monthly time frame. The range was even more pronounced in the second half of 2021. The highest point Gold reached in 2021 was $1960. Looking at Gold this year, the highest point it has reached is $2067.

    Monthly Chart

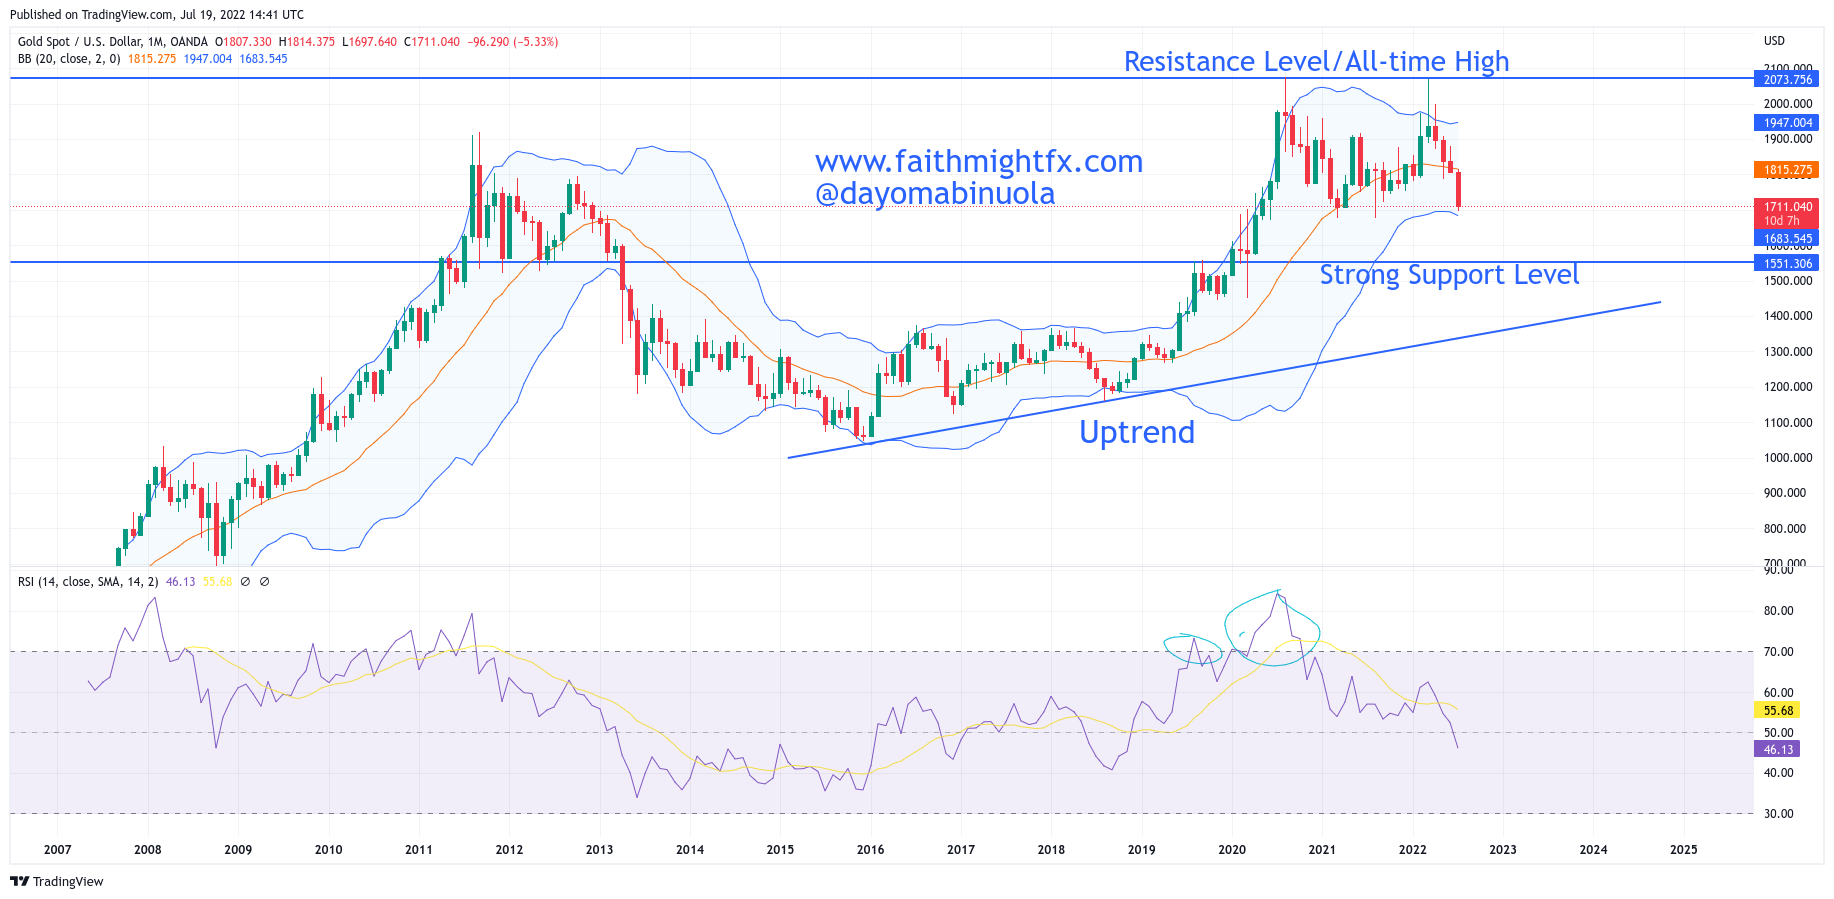
    On the 23rd of February 2022, we forecasted that Gold may not be able to keep up the bullish rally (see article). We were correct on that call because since March 2022, Gold has been falling. On the bearish run, Gold’s price fell to $1699, which stands as the lowest point this year. In the publication referred to earlier, a support line was drawn at $1676 and our analysts believe that with the current bearish force on Gold, that support level could be broken to the downside.

    Some of these ideas are in our clients’ portfolios. To understand if this one can work for you or for help to invest your own wealth, talk to our advisors at FM Capital Group. Would you like more information on how to get commodities in your portfolio? Schedule a meeting with us here

  • 1 Euro Equals 1 Dollar, First Time in 20years.

    1 Euro Equals 1 Dollar, First Time in 20years.

    The appreciation of the dollar against other currencies continues as a two decades record has been broken. From the time EURUSD has been listed on trading-view in May 1993, the lowest price of EURUSD stands at 0.82623. in November 2000. That is to say, the US dollar gained more than the EUR since its listing on trading-view. For another 8 years, the EURUSD appreciated to an all-time high at 1.6000 specifically in April 2008.

    Weekly Chart

    Since the appreciation of the EURUSD to the all-time high at 1.60000, on the monthly chart, there have been lower highs and lower lows. This movement signifies a downtrend. For the first time in 20 years, the EURSD reached a par as 1 EUR equals 1 Dollar on the 12th July, 2022.  in the next few months, Euro might bounce from the current support at 0.99960 to a new resistance at 1.07657. Currently, the dollar looks strong.

    Monthly Chart

    Some of these ideas are in our clients’ portfolios. To understand if this one can work for you or for help to invest your own wealth, talk to our advisors at FM Capital Group. Would you like more information on how to get currencies in your portfolio? Schedule a meeting with us here

  • USDJPY Reaches 136.00, First Time Since September 1998

    USDJPY Reaches 136.00, First Time Since September 1998

    On the USDJPY monthly chart, it took it 12 years for a head-and-shoulder pattern to be formed. The first shoulder was formed in 2004, followed by the head in 2011, and the second shoulder was formed in 2016. After the second shoulder was formed, price ranged for 6 years before a major rally started.  Despite the lockdown across the world in 2020, the YEN only gained the USD with few pips.

    Monthly Chart

    For the past 12 years, the USD has shown to be a stronger currency. The lowest price of $USDJPY was $5.956 in February 2012. The current price is at 135.508. The highest value of USDJPY since 2002 has been 135.126. Price was able to surpass the 2022 high few days ago after price reached $136.822, the highest price since September 1998. A consolidation in price might occur has the USD dollar has been massively gaining against the Japanese yen since the beginning of 2021.

    Weekly Chart

    This expected price consolidation might make price fall, which could in favour of the YEN in the next few weeks. The price could be at 130.00

    Some of these ideas are in our clients’ portfolios. To understand if this one can work for you or for help to invest your own wealth, talk to our advisors at FM Capital Group. Would you like more information on how to get currencies in your portfolio? Schedule a meeting with us here

  • Oil Price Loses Over $5 In A Day

    Oil Price Loses Over $5 In A Day

    In March 2022, price of WTI rose to $130.37 per barrel, making it the highest price of crude oil in 14 years. Ever since then, the year’s resistance was maintained at that level. The all-time high of crude oil price was reached at $147.40 per barrel in June 2008. During the global lockdown in April 2020, there was an historical price fall. The price of crude oil went as low as negative price, as WTI was at -$40. The price closed on the 20th of April 2020 at -$37.51, as there was little or no demand for crude oil globally. The next day after this historical fall, price was back to double-digits.

    Weekly Chart

    The most part of Q2 2022, shows price has been over $100 most of the time. Some analysts have concluded that world might see a recession soon. Commodity prices globally might fall if the recession becomes a reality. As investors have concerns about the likelihood of a recession, and the Biden administration is prepared to step up its fight against lofty pump prices by calling a tax holiday on gasoline. The WTI fell to 104.40 from $109.74. As it stands, the oil price is headed to the first monthly loss since November 2021. If this fall persists, the oil price might fall to $62.63 per barrel which was the December 2021 support level. On the daily chart, between January and February 2021, RSI showed at three different occasions where price of crude oil has been overbought.

    Daily Chart

    Some of these ideas are in our clients’ portfolios. To understand if this one can work for you or for help to invest your own wealth, talk to our advisors at FM Capital Group. Would you like more information on how to get commodities in your portfolio? Schedule a meeting with us here

  • Disney Share Price Heads Back To Lockdown’s Low

    Disney Share Price Heads Back To Lockdown’s Low

    Like many other stocks, Disney share price fell to $78.63 in March 2020 as a result of the global lockdown. Prior to the fall in 2020, Disney’s all-time high was at $154.84. The ease of lockdown led to the rally that pushed the price of Disney all the way up to $203.12 in March 2021. This price currently stands as the all-time high.

    Weekly chart

    After the all-time high, the share price was caught in a range on the weekly chart. The range began at the end of March 2021 and stretched to the first week of November 2021. The share price broke out of the range to the downside in the second week of November 2021. The breakout has led to a continuous downward slope in price as price as of June 23, 2022 is at $94.30, which is over a 50% loss from the all-time high.

    Daily Chart

    We can say Disney’s share price is currently in the region it was during the lockdown. Recent reports claim Disney’s share price dip is partly due to their insistence in inserting Queer ideology into its children movies which people see as “child-grooming” and therefore, reprehensible. Indications on RSI shows that price is currently oversold on the weekly time frame. Our analysts see Disney’s share price fall below the Lockdown low of $78.63.

    Some of these ideas are in our clients’ portfolios. To understand if this one can work for you or for help to invest your own wealth, talk to our advisors at FM Capital Group. Would you like more information on how to get stocks in your portfolio? Schedule a meeting with us here

  • Crypto Bulls To Resume Activities

    Crypto Bulls To Resume Activities

    In one of our articles written in Q4 2021 when the price of Bitcoin was at $58,229 and Ethereum at $4,200, we talked about price of Bitcoin to fall to $29,000. On the 10th of May, 2022, Bitcoin reached $29000, which was spot on. Many of the bulls have been liquidated due to the recent price fall. With the price fall of Bitcoin to $20,000, the gap up in December 2020 and January 2021 has been filled.

    Weekly Bitcoin Chart

    Our forecast currently shows crypto bulls are about to resume activities, as we might be seeing a rally in the coming weeks. Price of Bitcoin might be back to $48,000 and Ethereum to $3,500. This could be a sign of relief for investors after crypto has lost $1.1trillion in market capitalization in the last 80 days, the fastest and largest known loss in its history. Buying Bitcoin $48,000 and buying Ethereum above $3500 might be a bull trap. We might be seeing Bitcoin at a 4-digit value and Ethereum at a 2-digit value after prices reach $48,000. Are investors prepared to see price of Bitcoin at $4,000 and Ethereum at $90? Time will tell.

    Bitcoin Daily chart

    Yes, the market is about to favour the bulls, as a strong support is reached at $20,000 for bitcoin and Ethereum at $1,000. RSI on the weekly chart shows price has been oversold. There are some dojis formed in May and the first week in June, which is a sign of price reversal. Currently we still have price in the lower region of the Bollinger bands, as price  is consolidating.

    Ethereum Daily Chart

    Some of these ideas are in our clients’ portfolios. To understand if this one can work for you or for help to invest your own wealth, talk to our advisors at FM Capital Group. Would you like more information on how to get cryptocurrencies in your portfolio? Schedule a meeting with us here

  • Solana Falls Below $30

    Solana Falls Below $30

    The cryptocurrency space has suffered a setback in recent times as most crypto assets have dipped in price. This has led to the funds of many investors and traders being wiped out. The hope of price recovery keeps dashing out as price continue to fall.

    Daily Chart

    Solana is the 9th biggest cryptocurrency in the world by market cap, which stands at over $10.7billion. On the 13th of May, 2022, according to this article, Solana was at $52. Our analysts envisaged a continuous fall in price. On the 14th of June, price dipped to $25. The last time Solana price was at $25 was in July 2021, that’s about a year ago. Note that Solana reached an all-time high at $259 in November 2021.

    Monthly Chart

    The daily chart shows that the price of Solana has been oversold twice between May and June 2022 on the RSI. The NFT world has also suffered alongside this crypto crash. The value of all Ethereum and Solana-based projects have dropped across all boards. There are currently no indications of a price rally. The price of Solana is currently ranging, though the current price is at $31.395.

    Some of these ideas are in our clients’ portfolios. To understand if this one can work for you or for help to invest your own wealth, talk to our advisors at FM Capital Group. Would you like more information on how to get cryptocurrencies in your portfolio? Schedule a meeting with us here

  • Tides To Turn In Favor Of The New Zealand Dollar

    Tides To Turn In Favor Of The New Zealand Dollar

    On May 31 2022, we published an article that the NZDUSD bears will stay dominant. This turned out to be the case and furthermore, the forecast we made was hit a few days ago. Across the board, the USD has gained against all major currencies. 

    4hr Chart

    The support level of the year for NZDUSD is around 0.62205 and price fell this month to 0.62370 which is only a few pips above the support level. On the 4-Hour time frame, price is currently oversold. Also on the 4-Hour time frame, there are 5 dojis already formed which could be an indication of a possible reversal. 

    Daily Chart

    For the past two weeks, all candlesticks on the daily chart have closed bearish. We hope that in the next few days, as consolidation comes up, price could rally and a trend could begin in favor of the NZD. We look forward to NZDUSD appreciating to 0.64613 from its current price of 0.62493.

    Some of these ideas are in our clients’ portfolios. To understand if this one can work for you or for help to invest your own wealth, talk to our advisors at FM Capital Group. Would you like more information on how to get currencies in your portfolio? Schedule a meeting with us here

  • Block, Formerly Square, Loses More Than 50% Of Its Value In 2022

    Block, Formerly Square, Loses More Than 50% Of Its Value In 2022

    Since the price of Block reached its all-time high in August 2021 at $289.05, the bears have aggressively taken over the market. The monthly chart of $SQ throughout the year 2021 showed a ranging market. The price at the beginning of Q4 2021 was at $255.88. Q1 2022 began at $162.87, that’s about $100 loss in the space of one quarter. We wrote an article in December 2021 of a continued bearish trend of $SQ. At the time the article was written, price of $SQ was at $192.15. The price of Block as of 9th of June 2022 closed at $76.58.

    Monthly Chart

    Will the price of $SQ fall to the 2020 lockdown lowest price at $34.28? The company has lost 9.64% in the last 24hrs, lost 7.85% in the last 7 days and in the last one year, it has lost 63.57%. The market cap of the company is currently at $44.45billion. There are still no hopes of price rallying soon as price might still continue to range or fall further in the coming months. Investors have no choice at this time but to be patient as the effect of the newly introduced blockchain technology to $SQ could make the price rally in the second half of 2022.

    Daily Chart

    Some of these ideas are in our clients’ portfolios. To understand if this one can work for you or for help to invest your own wealth, talk to our advisors at FM Capital Group. Would you like more information on how to get stocks in your portfolio? Schedule a meeting with us here

  • Walmart Share Price Falls to A Two-Year Low

    Walmart Share Price Falls to A Two-Year Low

    The American multinational retail company reached an all-time high at $161.03 in April 2022. This point was reached after price ranged from the latter part of 2021 to March 2022. Following the range, price broke out and headed for the aforementioned point that became the all-time high. 

    Weekly Chart

    The month of May 2022 ended bearish after the price opened at $154.82 and closed at $128.38. The month of June 2022 has begun on a bearish note but $5 has been lost from the opening price of the month of June 2022 which was at $154.82. In May 2022, the price fell to as low as $117.05. Price last hit this point in July 2020.

    Monthly Chart

    RSI showed in Q4 2020 that price has been overbought. The trendline is yet to be broken despite the corrections. The 4-Hr Chart shows there was a gap down in the price of Walmart mid-May 2022. This gap down might close up and it could be an opportunity for the Walmart bulls to push price higher from the current price of $123.30. We might see price reach a new all-time high in the coming weeks.

    Some of these ideas are in our clients’ portfolios. To understand if this one can work for you or for help to invest your own wealth, talk to our advisors at FM Capital Group. Would you like more information on how to get stocks in your portfolio? Schedule a meeting with us here